17 Connecting the Greenbone Enterprise Appliance to Other Systems
The Greenbone Enterprise Appliance can be connected to other systems.
Some systems have already been integrated into the appliance by Greenbone:
verinice ITSM system (see Chapter 17.1)
Nagios Monitoring System (see Chapter 17.2)
Cisco Firepower Management Center (see Chapter 17.3)
The appliance offers numerous interfaces that allow for the communication with other systems:
- Greenbone Management Protocol (GMP)
The Greenbone Management Protocol allows to remote control the appliance completely. The protocol supports the creating of users, creating and starting of scan tasks and exporting of reports.
- Report format
The appliance can present the scan results in any format. To do so, the appliance already comes with a multitude of pre-installed report formats (see Chapter 10.1). Additional report formats may be developed in collaboration with Greenbone.
- Alert via Syslog, e-mail, SNMP trap or HTTP (see Chapter 9.12)
- Automatic result forwarding through connectors
These connectors are created by Greenbone, verified and integrated into the appliance.
- Monitoring via SNMP
The webpage https://docs.greenbone.net/API/SNMP/snmp-gos-22.04.en.html provides the current Management Information Base (MIB) file. MIB files describe the files that can be queried by SNMP about the equipment.
17.1 Using Verinice
Verinice is a free open-source Information Security Management System (ISMS) developed by SerNet.
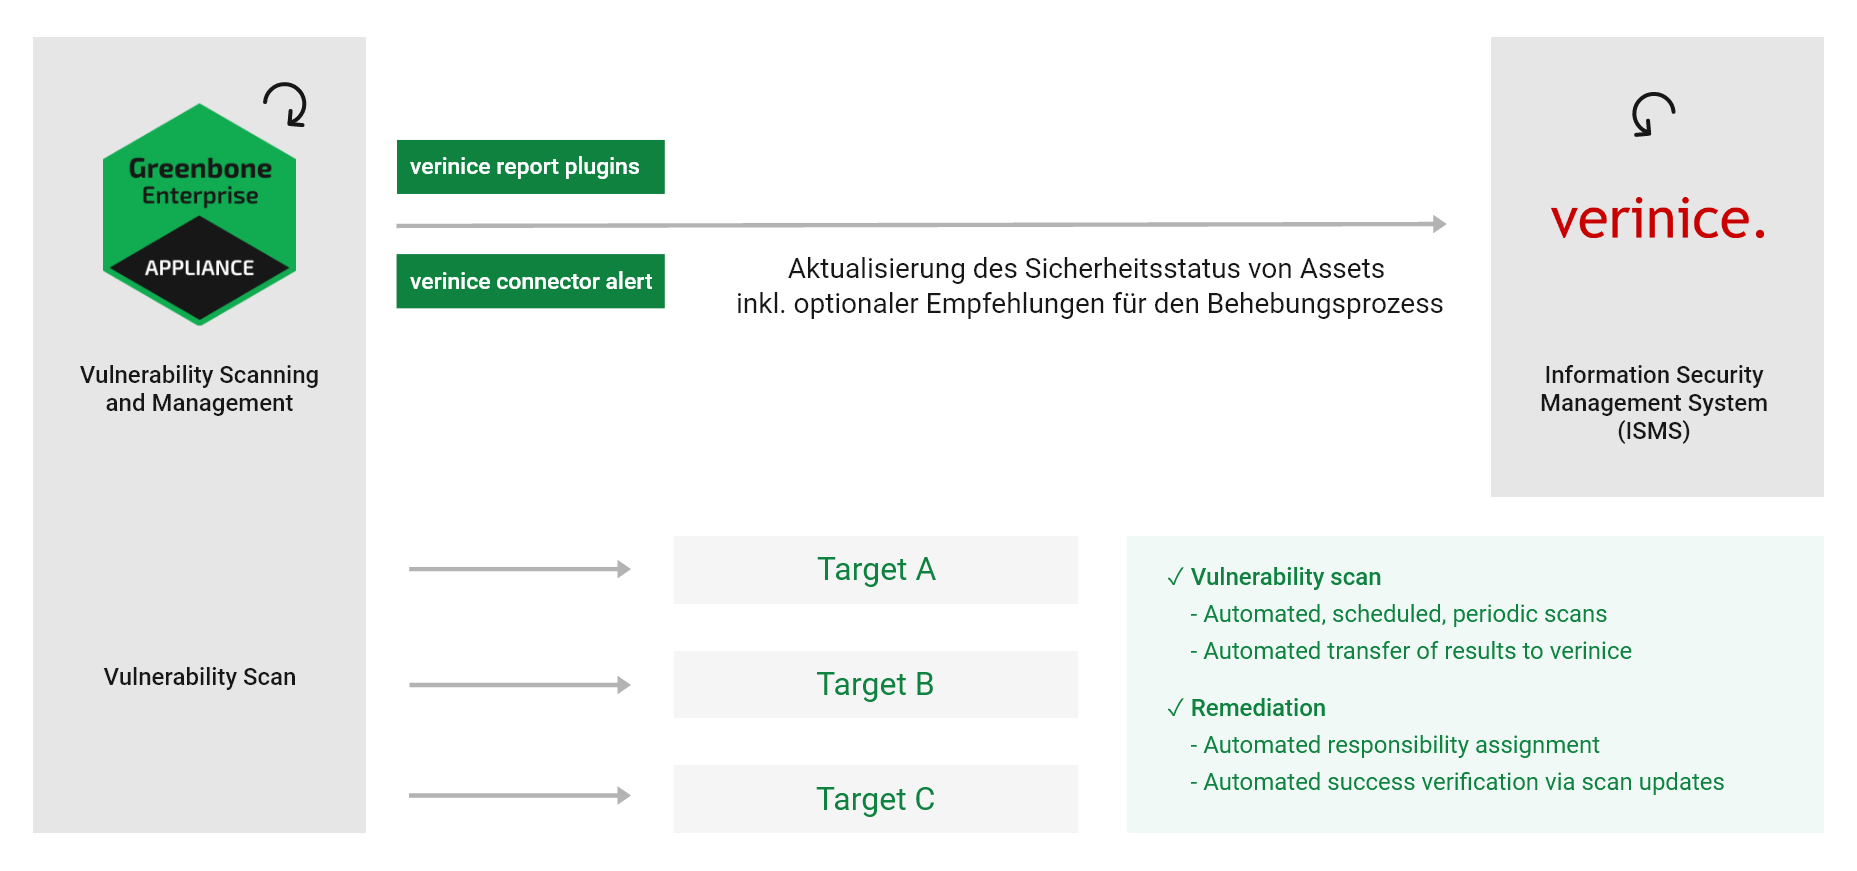
Fig. 17.1 Integrating the appliance with verinice
Verinice is suitable for:
Vulnerability remediation workflow
Performing risk analysis based on ISO 27005
Operating an ISMS based on ISO 27001
Performing an IS assessment per VDA specifications
Proof of compliance with standards such as ISO 27002, IDW PS 330
The appliance can support the operation of an ISMS. For this, Greenbone offers two report formats for exporting the data from the appliance into verinice:
Verinice ISM
Verinice ISM all results
It is possible to transfer data completely automated from the appliance to verinice.PRO, the server extension of verinice.
Note
For support with the use of the connector, contact SerNet or the Greenbone Enterprise Support.
17.1.1 IT Security Management
The report formats Verinice ISM and Verinice ISM all results for verinice are available via the Greenbone Enterprise Feed. With these report formats, Greenbone supports the vulnerability remediation workflow in verinice.
- Verinice ISM
When using the report format Verinice ISM, verinice uses the notes feature (see Chapter 10.7) to create objects for processing. A note must be attached to each scan results that should be transferred to verinice. If this report format is used and there are no notes in a task, only the assets as well as the complete vulnerability report will be imported.
- Verinice ISM all results
When using the report format Verinice ISM all results, all results are transferred by default. It is not necessary, to attach a note to the results that should be transferred to verinice.
After the scan is completed, the report must be exported using one of the report formats explained above (see Chapter 10.2.2). A VNA file is created. This is a ZIP file containing the scan data.
Note
For the following example SerNet verinice 1.18.1 was used.
If another version is used, the steps may differ. Contact the verinice support for help.
17.1.1.1 Importing the ISM Scan Report
The report can be imported in verinice as follows:
Start verinice.
Select View > Show Perspective > Information Security Management in the menu bar (see Fig. 17.2).
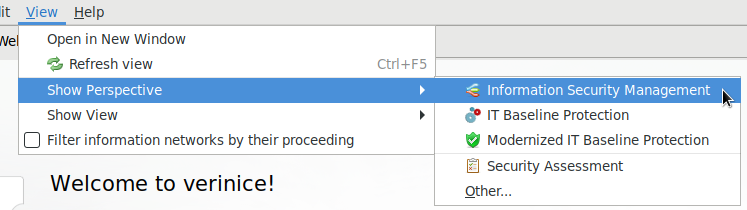
Fig. 17.2 Opening the perspective Information Security Management
Click
 in the window Catalogs to import the desired catalog.
Create an organization by clicking
 (see Fig. 17.3).
Note
The window for defining the details of the organization can simply be closed.
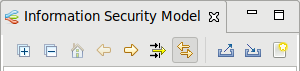
Fig. 17.3 Creating a new organization
In the window Information Security Model click
.Click Select file… and select the ISM report. The remaining parameters can be kept with their default settings (see Fig. 17.4).
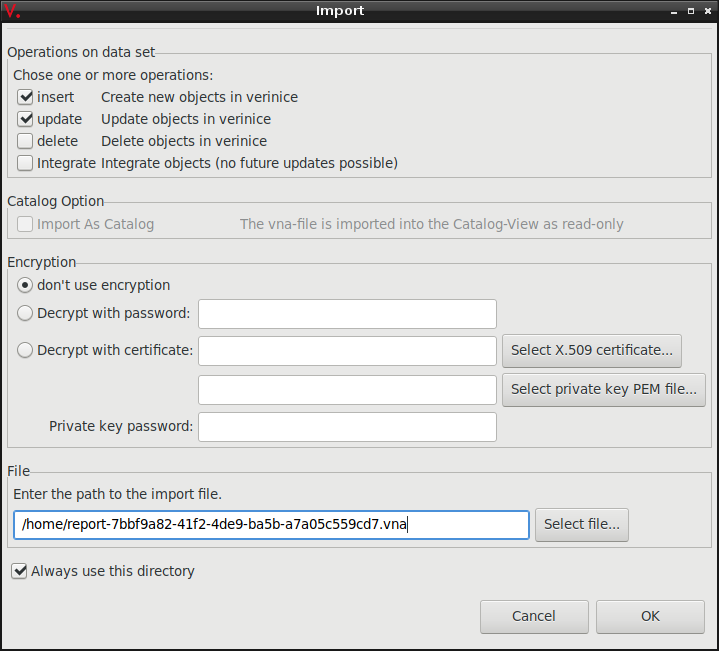
Fig. 17.4 Selecting the ISM report
Click OK.
→ The results of the ISM report are imported and can be unfolded in verinice (see Fig. 17.5).
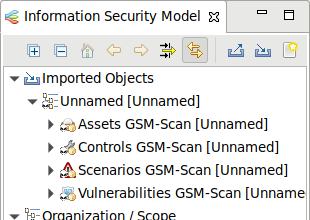
Fig. 17.5 Unfolding the results of the ISM report
The process to track vulnerabilities for the imported organization can be separated into two sub processes:
Creation of tasks
Remediation of vulnerabilities
17.1.1.2 Creating Tasks
Before creating tasks the data for the organization must be prepared as follows:
After the first import of an organization it must be moved from the group of imported objects to the top level.
Right click on the organization and select Cut. Click right in the top level in the window Information Security Model and select Paste.
The assets and controls must be grouped.
Right click on Assets GSM-Scan and select Group by Tags… (see Fig. 17.6).
Confirm the message by clicking OK.
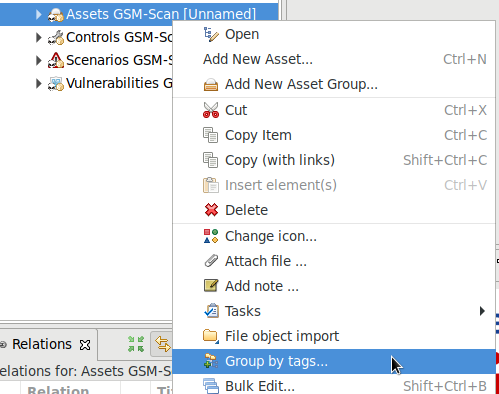
Fig. 17.6 Grouping the assets
Right click on Controls GSM-Scan and select Group by Tags….
Confirm the message by clicking OK.
All assets groups must be assigned a responsible person.
Expand the organization, right click on Persons and select Add Person….
Assign the newly created person per drag and drop to the assets group.
→ The successful assignment can be displayed in the window Relations by clicking Assets GSM-Scan (see Fig. 17.7).
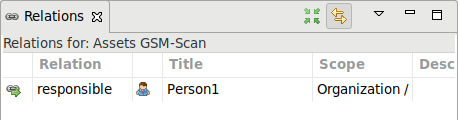
Fig. 17.7 Displaying the relations for a group
Right click on the organization and select Tasks > Greenbone: Start vulnerability process….
→ It is verified whether all assets and controls are grouped and whether all asset groups are assigned to a person. A message displays the result of the verification.
Continue with creating a task or cancel the creation.
The task to remediate vulnerabilities is called “Remediate Vulnerabilities”.
17.1.1.3 Remediating Vulnerabilities
The created tasks can be managed with the help of the view Task (View > Show View > Tasks in the menu bar) or the web frontend of the verinice.PRO version (under: ISO 27000 tasks).
A task contains controls, scenarios and assets that are connected to a control group and are assigned to a responsible person. The responsible person remediates the vulnerabilities for all assets.
Note
If the deadline for the task “Remediate Vulnerabilities” expires, a reminder e-mail is sent to the responsible person.
After the task is completed all connections between assets and scenarios that were assigned to a task are deleted.
The following states of a control are possible:
Implemented: no asset is assigned to the scenario anymore.
Partly: other connections to assets still exist.
17.2 Using Nagios
Nagios can integrate the scan results as an additional test in its monitoring tasks. The scanned systems are automatically matched with the monitored systems. With this the scan results are eventually available for the alert rules and other processes of Nagios.
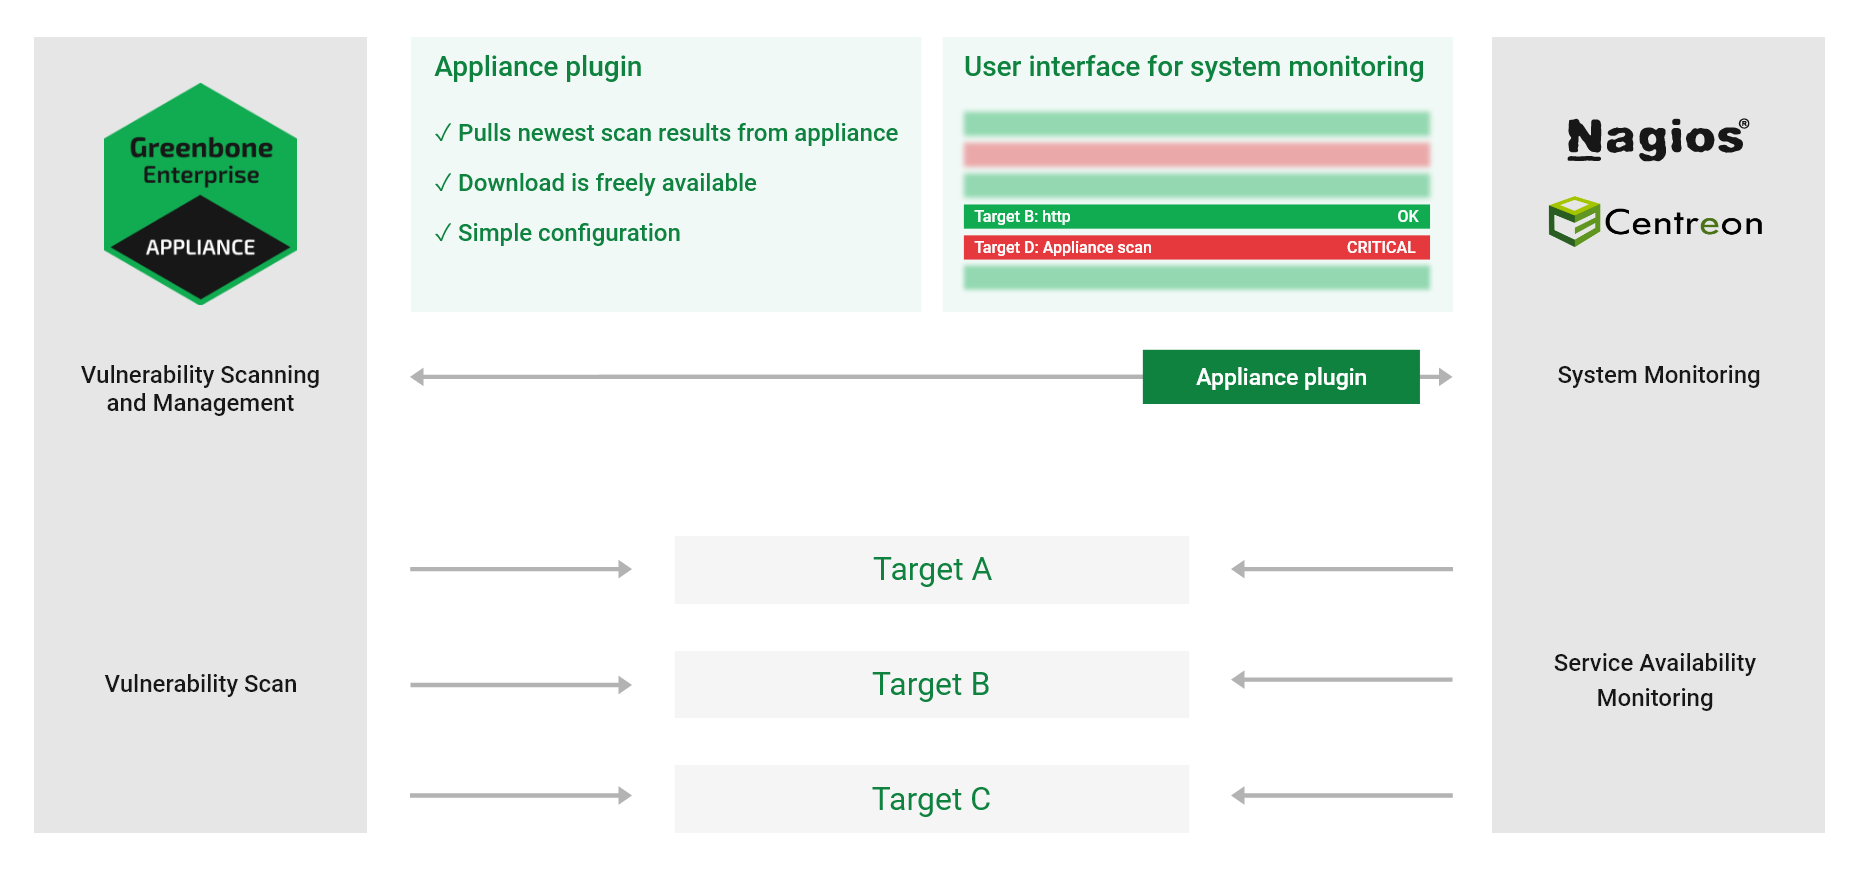
Fig. 17.8 Linking Nagios with the appliance
When linking Nagios with the appliance, Nagios will assume the controlling role.
Nagios retrieves the newest scan results from the appliance regularly and automatically.
This is done via a Nagios command which uses the tool gvm-script to call the script check-gmp.gmp.py.
Note
Other products compatible with Nagios such as Open Monitoring Distribution, Icinga, Centreon etc. should generally work but may require small adjustments to the described steps.
17.2.1 Configuring the Appliance User
For access, Nagios requires a user to log in to the appliance. For this user a scan target (or multiple scan targets) has to be set up with all hosts of which the security status should be monitored.
Note
The sample configuration used here assumes that there is only one relevant target but technically it is possible to link complex setups with multiple targets and multiple appliances.
The appliance user account provided for queries by the GMP script must be owner of the relevant scan targets or at least have unrestricted reading access to them.
The tasks should be run as scheduled scans regularly.
Additionally, network access via GMP to the appliance must be possible. Therefore, the GMP access must be activated in the GOS administration menu (see Chapter 14.2).
17.2.2 Configuring the Script
Greenbone provides the script check-gmp.gmp.py as part of the script collection of the gvm-tools (see Chapter 14.3).
This script can be called by the monitoring solution using gvm-script.
Note
The following assumes Nagios is installed in /usr/local/nagios/, afterwards referred to as /.../.
Adjust the file location if necessary.
Copy the plug-in to
/.../libexec/.Check if the script can reach the appliance through the network, GMP was activated and the user was created properly:
Note
In the following command, replace the IP address with the appliance’s IP address and provide the user name and the created password.
nagios-host# gvm-script --gmp-username="user name" --gmp-password="password" \
ssh --hostname 192.168.10.169 /.../libexec/check-gmp.gmp.py --ping \
GMP OK: Ping successful
Check whether there is access to the data:
nagios-host# gvm-script --gmp-username="user name" --gmp-password="password" \
ssh --hostname 192.168.10.169 /.../libexec/check-gmp.gmp.py \
-F 192.168.10.130 --last-report -T "Scan Suspect Host" --status
GMP CRITICAL: 284 vulnerabilities found - High: 118 Medium: 153 Low: 13
Report did contain 1 errors for IP 192.168.10.130
|High=118 Medium=153 Low=13
The script supports several command line switches. These can be displayed using:
nagios-host# gvm-script -c /.../etc/gvm-tools.conf ssh --hostname
  192.168.10.169 scripts/check-gmp.gmp.py -H
usage: check-gmp [-H] [-V] [--cache [CACHE]] [--clean] [-F HOSTADDRESS] [-T TASK]
...

Check-GMP Nagios Command Plugin 2.0.0 (C) 2017-2019 Greenbone Networks GmbH
...


optional arguments:
-H                    Show this help message and exit.
-V, --version         Show program's version number and exit
--cache [CACHE]       Path to cache file. Default: /tmp/check_gmp/reports.db.
--clean               Activate to clean the database.
...
If the tests were successful the check can be integrated into Nagios monitor.
Add the host to be monitored to the section
HOST DEFINITIONSin the Nagios configuration file/.../etc/objects/localhost.cfg.In this example the host is a Metasploitable Linux.
define host{
     use                     linux-server
     host_name               metasploitable
     alias                   metasploitable
     address                 192.168.10.130
     }
In the same configuration file, in the section
SERVICE DEFINITIONS, define a new service which calls the Nagios commandcheck_gmp_status.As the example shows, the name of the task where to fetch the report from is passed to the command as an argument.
define service{
     use                    local-service    ; Name of service template to use
     host_name              metasploitable
     service_description    GMP task last report status
     check_command          check_gmp_status!metasploitable
     }
Create the
check_gmp_statuscommand in the file/.../etc/objects/commands.cfg.
define command{
    command_name    check_gmp_status
    command_line    gvm-script -c /.../etc/gvm-tools.conf ssh
       --hostname 192.168.10.169 $USER1$/check-gmp.gmp.py -F $HOSTADDRESS$
         --last-report -T $ARG1$ --status
    }
Note
In the command line it can be seen that no user name and password options but a configuration file are passed to the tool gvm-script (see Chapter 14.3).
Restart the Nagios service to apply the new configuration.
nagios-host# systemctl restart nagios
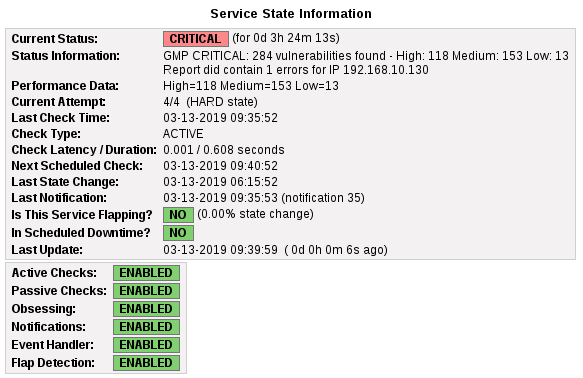
Fig. 17.9 Nagios displaying the monitored host status
17.2.3 Caching and Multiprocessing
The script check-gmp.gmp.py supports caching.
All new reports will be cached in a SQLite database.
The first call with an unknown host will take longer because the report needs to be retrieved from the appliance.
Subsequent calls will only retrieve the current report from the appliance if the end time of the scan differs.
Otherwise, the information from the database is used. This will greatly reduce the load both on the monitoring server and the appliance.
The cache file is written to /tmp/check_gmp/reports.db by default. A different location of the database can be specified using the command line switch --cache.
To further reduce the load both on the monitoring server and the appliance, the plug-in can restrict the maximum number of simultaneously running plug-in instances.
Additionally started instances are stopped and wait for their continuation. The default value of MAX_RUNNING_INSTANCES is 10. The default can be modified using the command line switch -I.
17.3 Using the Cisco Firepower Management Center
The Cisco Firepower Management Center (former Sourcefire Intrusion Prevention System (IPS)) is one of the leading solutions for intrusion detection and defense in computer networks. As a Network Intrusion Detection System (NIDS) it is tasked with the discovery, alerting and the defense against attacks on the network.
To identify and classify attacks correctly, the Firepower Management Center requires as much information as possible about the systems in the network, the applications installed on them, and the potential vulnerabilities for both. For this purpose the Firepower Management Center has its own asset database that can be augmented with information from the appliance. Additionally, the Firepower Management Center can start an automatic scan if it suspects anything.
The following connection methods are available:
- Automatic data transfer from the appliance to the NIDS/IPS
If the appliance and NIDS/IDS are configured respectively, the data transfer from the appliance to the NIDS/IPS can be utilized easily, like any other alert functionality of the appliance. After completion of the scan, the report will be forwarded as an alert to the NIDS/IPS with respect to the desired criteria. If the scan task is run automatically on a weekly basis, a fully automated alerting and optimization system is obtained.
- Active control of the appliance by the NIDS/IPS
In the operation of the NIDS/IPS, suspected incidents on systems with high risk can occur. In such a case, the NIDS/IPS can instruct the appliance to check the system [1].
Note
To use the connection methods, the option to receive the data must be enabled in the Firepower Management Center.
17.3.1 Configuring the Host-Input-API Clients
The Host-Input-API is an interface through which the Firepower Management Center accepts data from other applications for its asset database.
Log into the Firepower Management Center.
Select System > Integration in the menu bar.
Select the register Host Input Client.
Enter the IP address of the appliance in the input box Hostname (see Fig. 17.10).
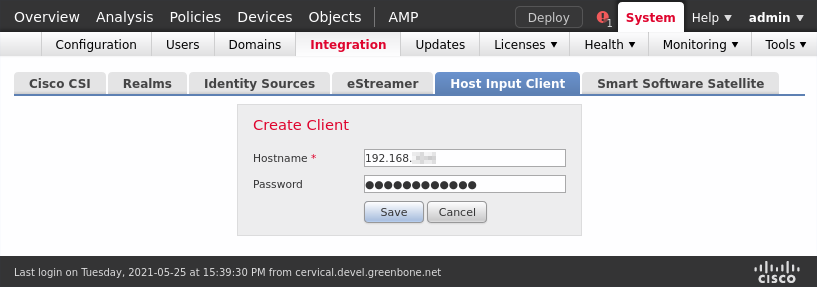
Fig. 17.10 Creating a host input client
Enter the password in the input box Password.
Click Save.
Note
The connection is TLS encrypted.
→ The Firepower Management Center creates a private key and certificate automatically.
In the certificate the IP address entered above will be used as common name and verified when the client is establishing a connection. If the client uses a different IP address, the connection fails.
The created PKCS#12 file is optionally secured by a password.
Afterwards the certificate and the key are created and made available as a download.
Click
 to download the file (see Fig. 17.11).
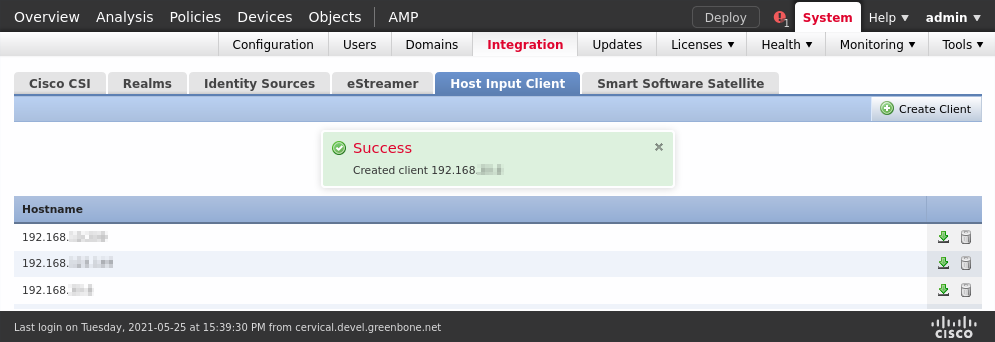
Fig. 17.11 Downloading the created PKCS#12 file
17.3.2 Configuring a Sourcefire Connector Alert
Now the respective alert must be set up on the appliance.
Select Configuration > Alerts in the menu bar.
Create a new alert by clicking
 .
.Define the alert (see Fig. 17.12).
Tip
For the information to enter in the input boxes see Chapter 9.12.
Choose Sourcefire Connector in the drop-down list Method.
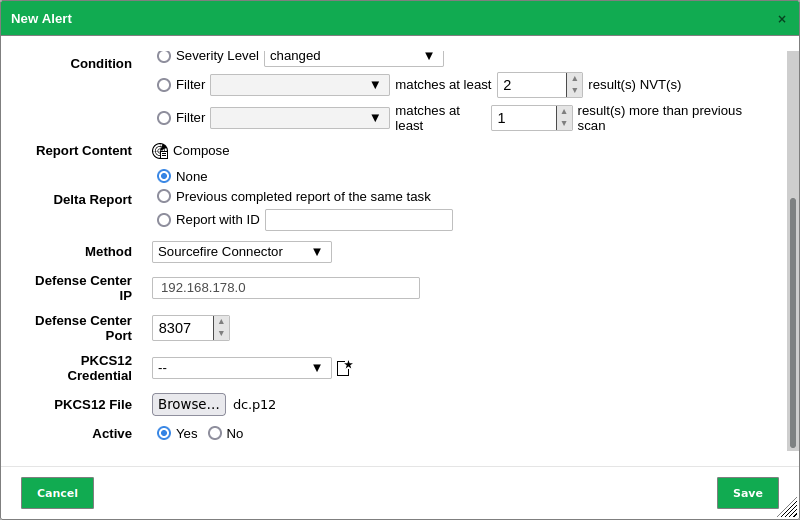
Fig. 17.12 Creating an alert with Sourcefire Connector
Enter the IP address of the Management Center in the input box Defense Center IP, and the port used to connect to it in the input box Defense Center Port.
Note
If a password was assigned when the client was created, the password for the PKCS#12 file must be provided as a credential (see Chapter 9.3.2.1).
Select the credential in the drop-down list PKCS12 Credential.
Note
A new credential can be created by clicking
.Provide the PKCS#12 file by clicking Browse….
Click Save.
17.4 Using Alemba vFire
vFire is an Enterprise Service Management application, developed by Alemba.
The appliance can be configured to create tickets in an instance of vFire based on events like finished scans.
17.4.1 Prerequisites for Alemba vFire
For the integration to work properly, the following prerequisites must be met on the vFire system:
The vFire installation must support the RESTful Alemba API, which has been added in vFire version 9.7. The legacy API of older versions is not supported by the Greenbone connector.
An Alemba API client with the correct session type (analyst/user) and password login must be enabled.
The user account that should be used requires permissions to use the Alemba API.
17.4.2 Configuring an Alemba vFire Alert
To have the appliance automatically create tickets (called “calls”) in vFire, an alert must be set up as follows:
Select Configuration > Alerts in the menu bar.
Create a new alert by clicking
.Define the alert (see Fig. 17.13).
Tip
For the information to enter in the input boxes see Chapter 9.12.
Choose Alemba vFire in the drop-down list Method.
Click Save.
The following details of the alert can be defined:
- Report Formats
The report formats used for the attachments. Multiple report formats can be selected or the selection can be left empty if no attachments are wanted.
- Base URL
This is the URL of the Alemba instance including the server name and the virtual directory. For example, if the user interface is accessed via
https://alemba.example.com/vfire/core.aspx, the base URL would behttps://alemba.example.com/vfire.- Credential
The user name and the password used for logging into Alemba vFire.
- Session Type
The type of session to use. It can be either “analyst” or “user”.
As an “analyst” it is possible to perform some actions not available to a “user”. The “user” requires special permissions for these actions and the number of concurrent logins may be limited.
- Alemba Client ID
This is the Alemba API client ID (see Chapter 17.4.1).
- Partition
The partition to create the ticket in. See the Alemba vFire help for more information about partitioning.
- Call Description
This is the template for the description text used for the newly created calls. The same placeholders as in the message input box of the e-mail alert method can be used (see Chapter 9.12).
- Call Template
The name of a call template to use for the calls created by the alert. A call template can be configured in vFire to fill in all the fields that cannot be specified directly in the alert.
- Call Type
The name of a call type to use for the calls created by the alert.
- Impact
The full name of an impact value.
- Urgency
The full name of an urgency value.
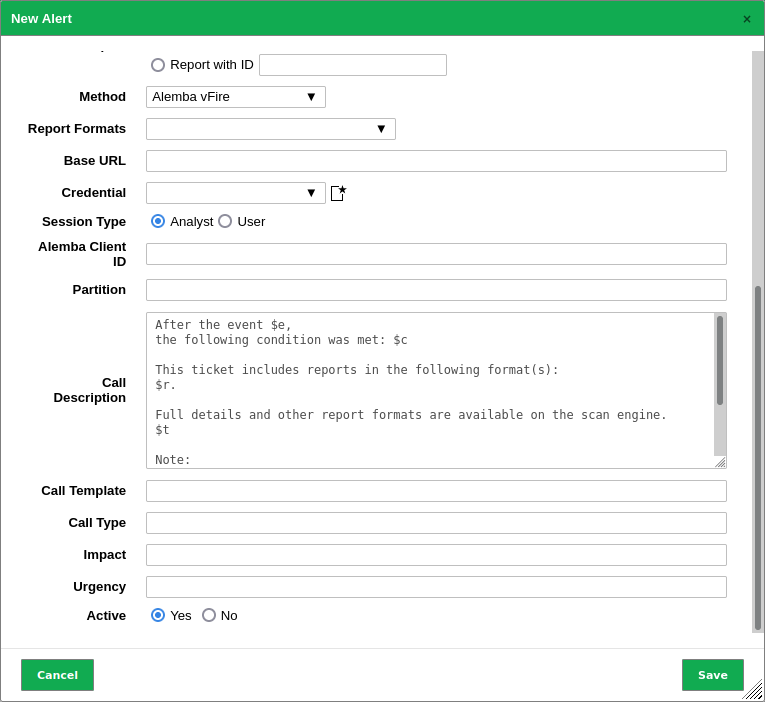
Fig. 17.13 Creating an alert with Alemba vFire
17.5 Using Splunk
The appliance can be configured to forward the scan results to a Splunk enterprise installation for further analysis and correlation.
Connecting an appliance to a Splunk solution is not part of the appliance’s core functionality. As an add-on, Greenbone provides an app for the integration with Splunk Enterprise on-premise solutions. The app is currently available at https://download.greenbone.net/tools/Greenbone-Splunk-App-1.0.1.tar.gz.
Important
External links to the Greenbone download webpage are case-sensitive.
Note that upper cases, lower cases and special characters have to be entered exactly as they are written here.
Note
If there are problems with downloading or testing the app contact the Greenbone Enterprise Support.
In the following Splunk Enterprise version 8.5 is used. The installation of the app on Splunk Light is not supported. Connecting an appliance to Splunk Cloud is not supported.
17.5.1 Setting up the Greenbone-Splunk App
17.5.1.1 Installing the App
The Greenbone-Splunk app can be installed as follows:
Open Splunk Enterprise.
Click
 in the left menu panel (see Fig. 17.14).
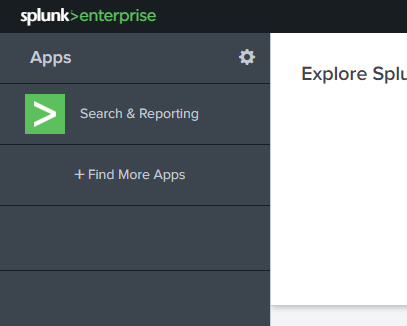
Fig. 17.14 Installing the Splunk app
Click Install app from file.
Click Browse….
Select the TAR file of the Greenbone-Splunk app.
Click Upload.
17.5.1.2 Configuring the Greenbone-Splunk App
The port of the Greenbone-Splunk app is required for the configuration on the appliance.
Check the port of the Greenbone-Splunk app as follows:
Select the Greenbone-Splunk app in the left menu panel.
Select Settings > Data inputs in the menu bar.
Click TCP (see Fig. 17.15).
Note
The Greenbone-Splunk app sets up a data input on port 7680/TCP (default port) and tags the incoming data to Greenbone Scan Results and places it in the index default.
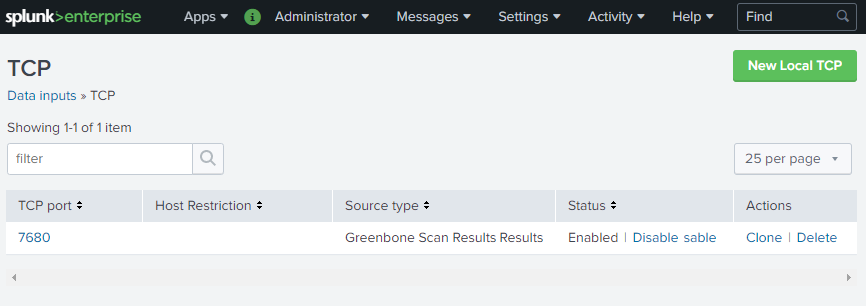
Fig. 17.15 Checking the port of the Greenbone-Splunk app
To make the data more user-friendly, the field names can be replaced as follows:
Click
in the left menu panel.In the row of Greenbone, click View objects.
Click Greenbone Scan Results: FIELDALIAS-reportfields.
Enter the field name aliases in the respective input boxes (see Fig. 17.16).
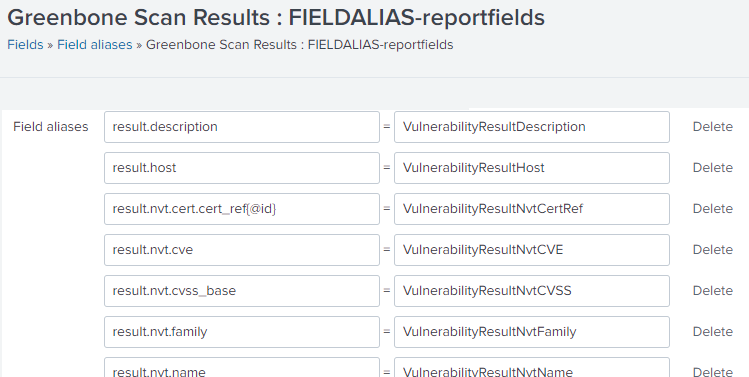
Fig. 17.16 Changing the field name aliases
17.5.2 Configuring a Splunk Alert
The appliance transfers the scan results in the form of an XML report via an alert directly to the Splunk main server.
Note
The dashboard of the Greenbone-Splunk app only shows results from reports less than 7 days old.
If a report older than 7 days is sent, the dashboard will not display the results. However, the results are in the main index of the Splunk server.
17.5.2.1 Creating the Splunk Alert
The alert is created as follows:
Select Configuration > Alerts in the menu bar.
Create a new alert by clicking
.Define the alert (see Fig. 17.17).
Tip
For the information to enter in the input boxes see Chapter 9.12.
Choose Send to host in the drop-down list Method.
Enter the IP address of the Splunk server in the input box Send to host and
7680in the input box on port.Note
The TCP port is 7680 by default.
This setting can be checked in the Greenbone-Splunk app as described in Chapter 17.5.1.2.
Choose XML in the drop-down list Report.
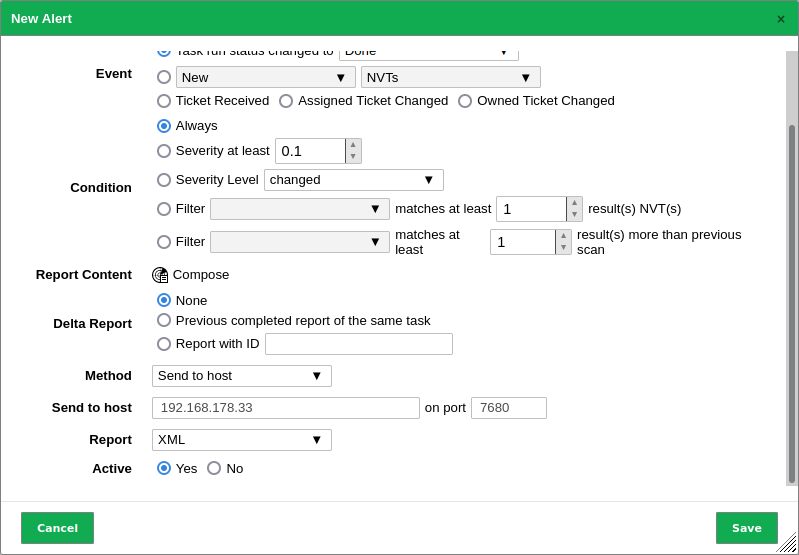
Fig. 17.17 Configuring the Splunk alert
Click Save.
17.5.2.2 Adding the Splunk Alert to a Task
The alert can now be selected when creating a new task (see Chapter 9.2.2) or be added to an existing task (see Chapter 9.12.2).
17.5.2.3 Testing the Splunk Alert
For testing purposes existing reports may be processed by the alert.
Select Scans > Reports in the menu bar.
Click on the date of a report.
Click
 .
.Select the alert in the drop-down list Alert (see Fig. 17.18).
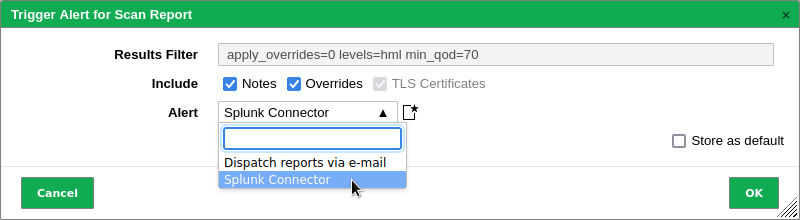
Fig. 17.18 Triggering the alert
Click OK.
17.5.3 Using the Greenbone-Splunk App
17.5.3.1 Accessing the Information in Splunk
To access the information in Splunk open the Greenbone dashboard as follows:
Open Splunk Enterprise.
Select the Greenbone-Splunk app in the left menu panel.
Select Dashboards in the menu bar.
Click Greenbone Dashboard.
Note
The dashboard of the Greenbone-Splunk app only shows results from reports less than 7 days old.
If a report older than 7 days is sent, the dashboard will not display the results. However, the results are in the main index of the Splunk server.
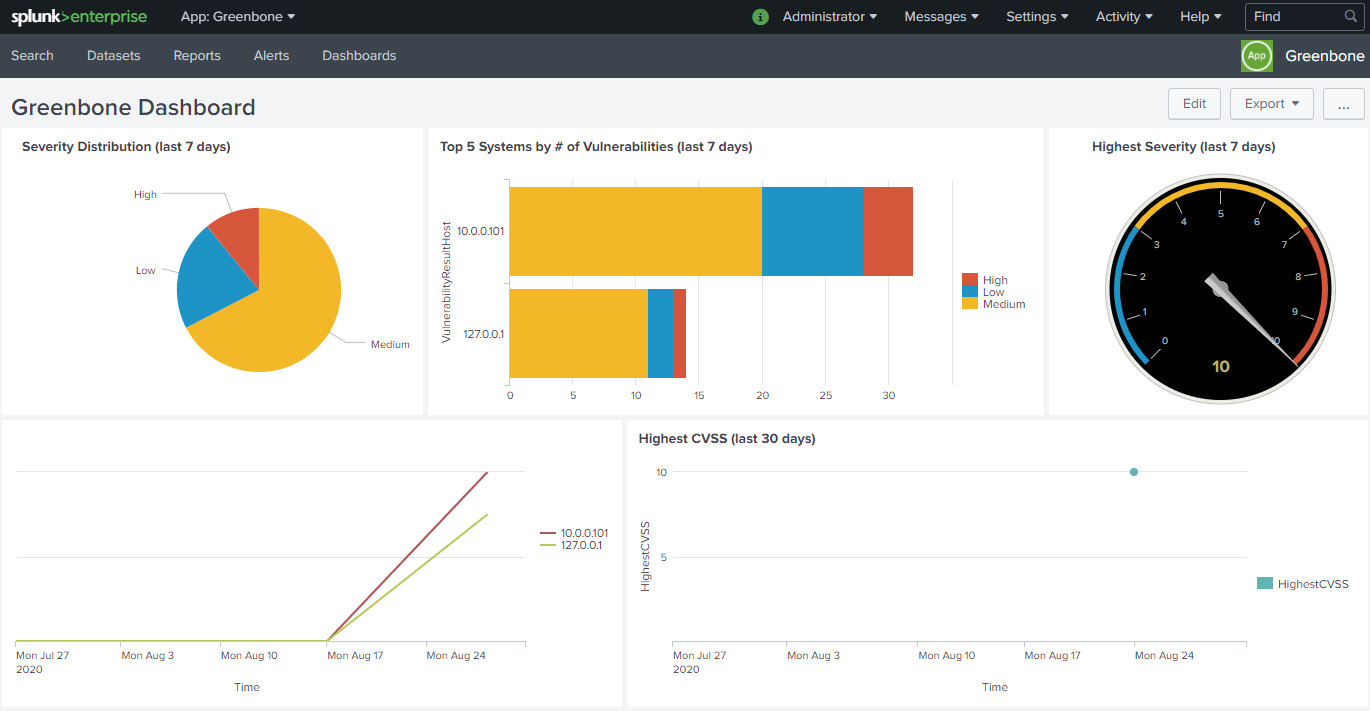
Fig. 17.19 Greenbone dashboard within the Greenbone-Splunk app
The input field CVE-ID below the dashboard can be used to display the number of hosts affected by a certain CVE over time.
Note
If the input box is left empty and Enter is pressed, the number of hosts affected by all CVEs is displayed.
17.5.3.2 Performing a Search
Since the information forwarded by the appliance is indexed by Splunk, the search view can be used to search for any data as follows:
Open Splunk Enterprise.
Select the Greenbone-Splunk app in the left menu panel.
Select Search in the menu bar.
Enter the index and the value that should be searched in the input box.
Select the time window in the drop-down list right of the input box.
Click
 .
.
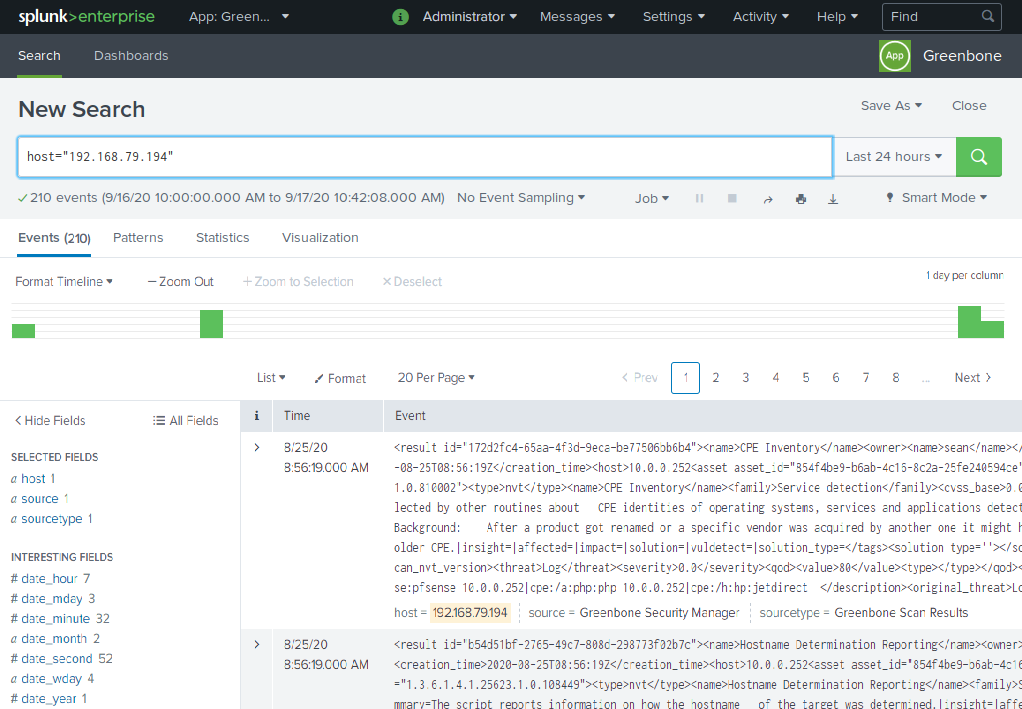
Fig. 17.20 Carrying out a search in the Greenbone-Splunk app
Some supported indexes are:
host
source, sourcetype
date_hour, date_minute, date_month, date_year, date_mdate, date_wday, date_zone
VulnerabilityResultNvtCVE
VulnerabilityResultNvtCVSS
VulnerabilityResultQod
VulnerabilityResultSeverity
VulnerabilityResultThreat
17.5.3.3 Creating a Dashboard for the Top 5 Affected Hosts and for Incoming Reports
A new dashboard can be created to show the top 5 affected hosts of all time and the incoming reports from the appliance. The dashboard will show each time a new report comes in to the Splunk server for the past year.
Open Splunk Enterprise.
Select the Greenbone-Splunk app in the left menu panel.
Select Dashboards in the menu bar.
Click Create New Dashboard.
Enter a title in the input box Title, for example
Greenbone incoming stats.Click Create Dashboard.
Click Source.
Copy and paste the following into the input field (replacing all):
<dashboard> <label>Greenbone incoming stats</label> <row> <panel> <title>Top 5 all time</title> <chart> <search> <query>sourcetype = "Greenbone Scan Results" VulnerabilityResultSeverity > 0 | chart count over VulnerabilityResultHost by VulnerabilityResultThreat | fillnull High | fillnull Medium | fillnull Low | eval _count= High+Low+Medium | sort by _count desc | head 5</query> <earliest>0</earliest> <latest></latest> </search> <option name="charting.axisLabelsX.majorLabelStyle.overflowMode">ellipsisNone</option> <option name="charting.axisLabelsX.majorLabelStyle.rotation">0</option> <option name="charting.axisTitleX.visibility">visible</option> <option name="charting.axisTitleY.visibility">visible</option> <option name="charting.axisTitleY2.visibility">visible</option> <option name="charting.axisX.scale">linear</option> <option name="charting.axisY.scale">linear</option> <option name="charting.axisY2.enabled">0</option> <option name="charting.axisY2.scale">inherit</option> <option name="charting.chart">bar</option> <option name="charting.chart.bubbleMaximumSize">50</option> <option name="charting.chart.bubbleMinimumSize">10</option> <option name="charting.chart.bubbleSizeBy">area</option> <option name="charting.chart.nullValueMode">gaps</option> <option name="charting.chart.showDataLabels">none</option> <option name="charting.chart.sliceCollapsingThreshold">0.01</option> <option name="charting.chart.stackMode">stacked</option> <option name="charting.chart.style">shiny</option> <option name="charting.drilldown">all</option> <option name="charting.fieldColors">{"High":0xD6563C,"Medium":0xF2B827, "Low":0x1E93C6}</option> <option name="charting.layout.splitSeries">0</option> <option name="charting.layout.splitSeries.allowIndependentYRanges">0</option> <option name="charting.legend.labelStyle.overflowMode">ellipsisMiddle</option> <option name="charting.legend.placement">right</option> <option name="refresh.display">progressbar</option> </chart> </panel> </row> <row> <panel> <chart> <title>Incoming feed to Greenbone App</title> <search> <query>| tstats count where sourcetype = "Greenbone Scan Results" by sourcetype _time | timechart span=1d count by sourcetype</query> <earliest>@y</earliest> <latest>now</latest> </search> <option name="charting.chart">line</option> <option name="refresh.display">progressbar</option> </chart> </panel> </row> </dashboard>
Click Save.
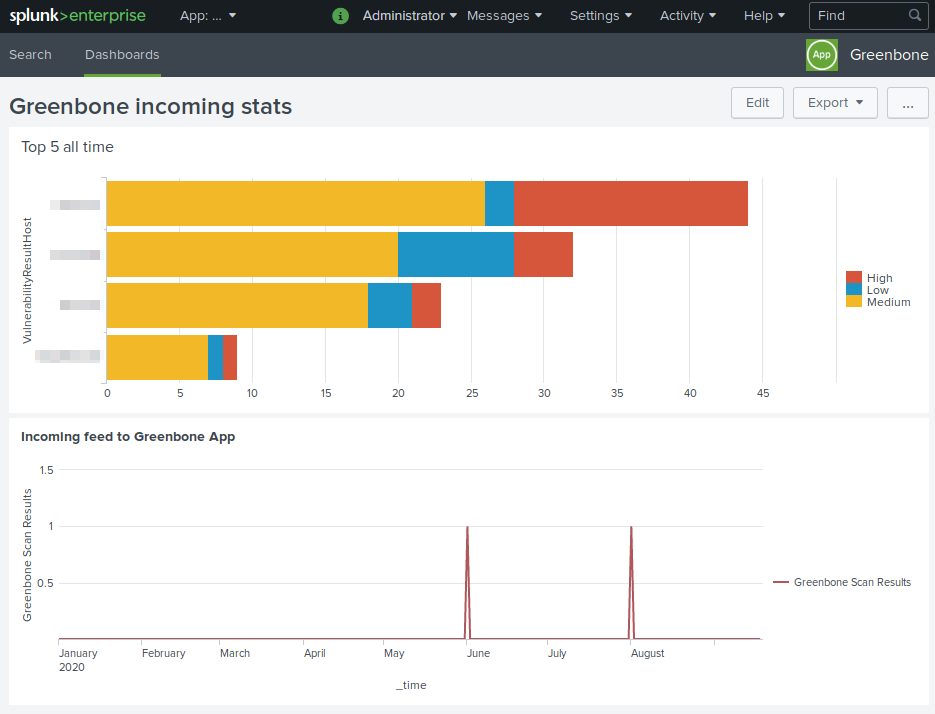
Fig. 17.21 Dashboard for the top 5 affected hosts and for incoming reports
Footnotes