
11. Reports and Vulnerability Management
Note
This chapter documents all possible menu options.
However, not all GSM types support all of these menu options. Check the tables in Chapter 3 to see whether a specific feature is available for the used GSM type.
The results of a scan are summarized in a report. Reports can be displayed on the web interface and downloaded in different formats.
The GSM saves all reports of all scans in a local database. Not only is the last report of a scan saved but all reports of all scans ever run. This allows access to information from the past. The reports contain the discovered vulnerabilities and information of a scan.
Once a scan has been started, the report of the results found so far can be viewed. When a scan is completed, the status changes to Done and no more results will be added.
11.1. Configuring and Managing Report Formats
Report formats are defined as the formats a report is created from, based on the scan results. Many report formats reduce the available data in order to display it in a meaningful way.
The report formats can be used to export report information into other document formats so they can be processed by other third party applications (connectors).
The name of the exported report is configurable in the user settings (see Chapter 8.7).
The native GSM XML format contains all data and can be used to import exported reports on another GSM. To do so, create a container task (see Chapter 10.5).
Greenbone Networks supports the creation of additional report formats via report format plug-ins. Requests, suggestions and concrete templates are welcome.
The report format plug-in framework has the following properties:
- Simple import/export
- A report format plug-in is always a single XML file. The import can be performed easily.
- Parameterized
- Plug-ins can contain parameters that can be used to adapt the plug-in to specific requirements using the web interface.
- Content type
- For every plug-in it is determined of which type the result is. Depending on the content type the plug-ins are displayed in contextual relation. For example, the types text/* for the sending as e-mail inline.
- Signature support
- The Greenbone Security Feed provides signatures for trusted plug-ins. By that it can be verified that an imported plug-in was verified by Greenbone Networks.
11.1.1. Default Report Formats
By default, the following report formats are available:
- Anonymous XML
- This is the anonymous version of the XML format. IP addresses are replaced by random IP addresses.
- ARF: Asset Reporting Format v1.0.0
- This format creates a report that represents the NIST Asset Reporting Format.
- CPE – Common Platform Enumeration CSV Table
- This report selects all CPE tables and creates a single comma-separated file.
- CSV Hosts
- This report creates a comma-separated file containing the systems discovered.
- CSV Results
- This report creates a comma-separated file with the results of a scan.
- GSR HTML – Greenbone Security Report (recommended)
- This is the complete Greenbone Security report with all vulnerabilities and results. It can be opened with any web browser and contains dynamically sortable lists as known from the web interface. The language of the report is English.
- GSR PDF – Greenbone Security Report (recommended)
- This is the complete Greenbone Security report with all vulnerabilities in graphical format as a PDF file. The topology graph is not included if more than 100 hosts are covered in the report. The language of the report is English.
- GXR PDF – Greenbone Executive Report (recommended)
- This is a shortened report with all vulnerabilities in graphical format as a PDF file for management. The topology graph is not included if more than 100 hosts are covered in the report. The language of the report is English.
- ITG – IT-Grundschutz catalog
- This report is guided by the BSI IT-Grundschutz catalog. It provides an overview of the discovered results in tabular view in CSV format. The language of the report is German.
- LaTeX
- This report is offered as LaTeX source text. The language of the report is English.
- NBE
- This is the old OpenVAS/Nessus report format. It does not have support for notes, overrides and some additional information.
- This is a complete report in PDF. Like the HTML format it is neutral. The language of the report is English.
- Topology SVG
- This presents the results in an SVG picture.
- TXT
- This creates a text file. This format is especially useful when being sent by e-mail. The language of the report is English.
- Verinice ISM
- Creates an import file for the ISMS tool verinice.
- Verinice ITG
- Creates an import file for the ISMS tool verinice.
- XML
- The report is exported in the native XML format. Contrary to the other formats this format contains all results and does not format them at all.
11.1.2. Managing Report Formats
List Page
All existing report formats can be displayed by selecting Configuration > Report Formats in the menu bar.
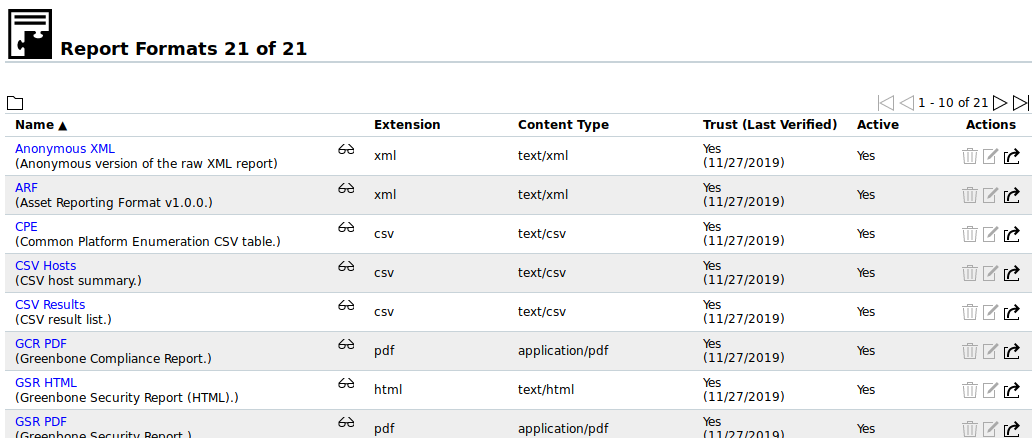
Fig. 11.1 Page Report Formats displaying all available report formats
For all report formats the following information is displayed:
- Name
- Name of the report format.
A global report format is marked with
 .
. - Extension
- The file name of the downloaded report consists of the UUID (unique internal ID of the report) and this extension. Among others, the extension supports the browser to start a compatible application in case the specified content type is not recognized.
- Content Type
The content type specifies the format in use and is transmitted when being downloaded. By this, a compatible application can be launched by the browser.
Additionally, the content type is important internally: it is used to offer suitable plug-ins within its context. For example, when sending a report via e-mail all plug-ins of the type
text/\*are offered as they can be embedded in an e-mail in a humanly readable way.- Trust
- Some report formats only convert data, while others perform more complex operations and also execute programs. To prevent abuse, each report format plug-in has to be digitally signed by Greenbone Networks. The digital signatures are distributed via the Greenbone Security Feed. If a signature is authentic and the publisher is trusted, it is ensured that the report format exists in the exact format as certified by the publisher. The trust check is automatic and the result can be seen in the column Trust (Last Verified).
- Active
- The report formats are only available in the respective selection menus if they are activated. Newly imported report formats are always deactivated at first. A report format can only be activated if it is trusted.
For all report formats the following actions are available:
 Delete the report format. Only self-created report formats can be deleted.
 Edit the report format. Only self-created report formats can be edited.
 Export the report format as an XML file.
Note
By clicking or below the list of report formats more than one report format can be deleted or exported at a time. The drop-down-list is used to select which report formats are deleted or exported.
Details Page
Click on the name of a report format to display the details of the report format.
Click  to open the details page of the report format.
The following actions are available in the upper left corner:
 Open the corresponding chapter of the user manual.
 Show the list page of all report formats.
 Add a new report format (see Chapter 11.1.3).
- Edit the report format. Only self-created report formats can be edited.
 Delete the report format. Only self-created report formats can be deleted.
- Export the report format as an XML file.
11.1.3. Adding a Report Format
Note
To prevent abuse, all additionally imported report formats have to be reviewed and digitally signed by Greenbone Networks. Report formats that are not signed by Greenbone Networks are not supported in GOS, and cannot be used.
For more information see Chapter 11.1.2 – Trust.
Note
Greenbone Networks offers the following additional report format plug-ins:
A new report format can be imported as follows:
Download the report format plug-in from one of the links mentioned above.
Important
External links to the Greenbone download website are case-sensitive.
Note that upper cases, lower cases and special characters have to be entered exactly as they are written in the footnotes.
Select Configuration > Report Formats in the menu bar.
Click
 .
.Click Browse… and select the previously downloaded report format plug-in (see Fig. 11.2).
Click Save.
→ The imported report format is displayed on the page Report Formats.
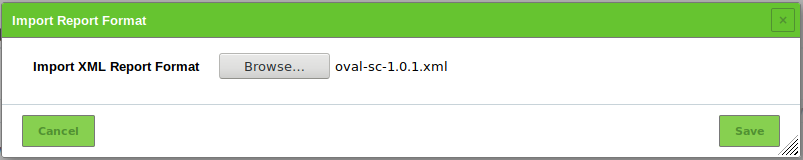
Fig. 11.2 Importing a report format plug-in
In the row of the report format click
.For Active select the radiobutton Yes (see Fig. 11.3).
Click Save.
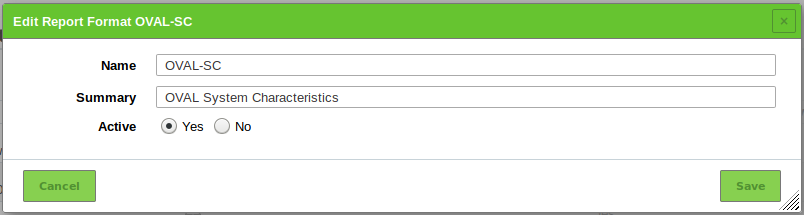
Fig. 11.3 Activating a new report format
11.2. Using and Managing Reports
All existing reports for all scans can be displayed by selecting Scans > Reports in the menu bar.
The total number of reports of a specific task is displayed on the page Tasks in the column Reports.
The reports for a specific task can be displayed as follows:
Select Scans > Tasks in the menu bar.
For the desired task click on the total number of reports in the column Reports to display all reports.
→ The page Reports is opened. A filter is applied to show only the reports for the selected task.
Tip
By clicking on the date in the column Last Report the details page of the latest report is opened (see Chapter 11.2.1).
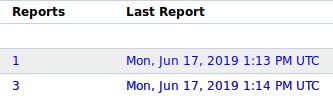
Fig. 11.4 Amount of reports saved in total and date of the last report
For every report the following information is displayed:
- Date
- Date and time of report creation.
- Status
- Status of the corresponding task.
- Task
- Corresponding task.
- Severity
- Highest severity found by the scan.
- High/Medium/Low/Log/False Pos.
- Number of found vulnerabilities for each severity.
For all reports the following actions are available:
 Create a delta report (see Chapter 11.2.5).
- Delete the report.
Note
By clicking below the list of reports more than one report can be deleted at a time. The drop-down-list is used to select which reports are deleted.
11.2.1. Reading a Report
Click on the date of a report to display the details of the report.
The following registers are available:
- Information
- General information about the corresponding scan.
- Results
- List of all results in this report (see Chapter 11.2.1.1).
- Hosts
- Scanned hosts with host names and IP addresses. The detected operating systems, the number of found vulnerabilies for each severity and the highest severity found by the scan are displayed.
- Ports
- Scanned ports with port name, number of hosts and highest severity found by the scan.
- Applications
- Scanned applications with CPE of the application, number of hosts, number of occurrences of results that detected this CPE and highest severity found by the scan.
- Operating Systems
- Scanned operating systems with system name, host name, number of scanned hosts and highest severity found by the scan.
- CVEs
- CVEs found with the scan.
- Closed CVEs
- CVEs of originally detected vulnerabilities which were already confirmed as solved during the scan.
- TLS Certificates
- TLS certificates found with the scan.
- Error Messages
- Error messages that occurred during the scan.
- User Tags
- Assigned tags (see Chapter 8.5).
The report content can be sorted by a chosen column by clicking on the column title. The content can be sorted ascending or descending:
 in the column title shows that the obejcts are sorted ascending.
 in the column title shows that the objects are sorted descending.
The following actions are available in the upper left corner:
- Open the corresponding chapter of the user manual.
- Show the list page of all report formats.
 Add the report contents that have at least a QoD of 70 % and enabled overrides to the assets.
 Remove the report contents from the assets.
 Show the corresponding task.
 Open the page Results. A filter is applied to show only the results for this report.
 Open the page Vulnerabilities. A filter is applied to show only the vulnerabilities for this report.
 Open the page Performance. The date, start and end time is preset for the corresponding task.
 Download a filtered report (see Chapter 11.2.2).
 Trigger an alert to send a report (see Chapter 11.2.4).
11.2.1.1. Results of a Report
The register Results contains a list of all vulnerabilities detected by the GSM (see Fig. 11.5).
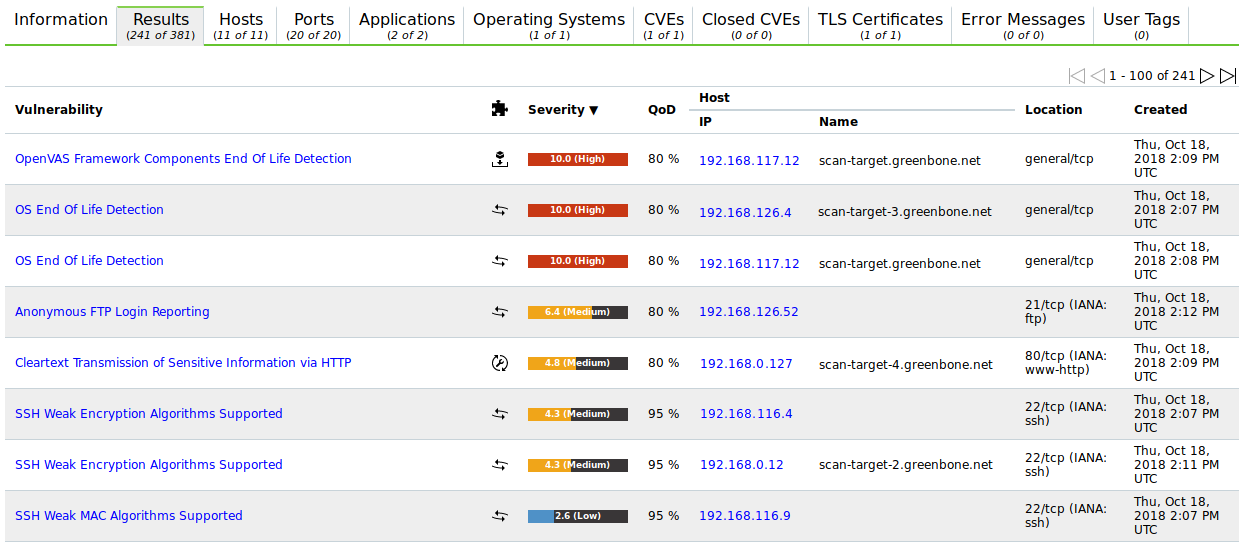
Fig. 11.5 Register Results showing a list of discovered vulnerabilities
Note
By default, overrides are not applied. They can be applied by filtering the report (see Chapter 11.2.1.3).
For every result the following information is displayed:
- Vulnerability
Name of the found vulnerability. By clicking on the name of a vulnerability details of the vulnerability are shown (see Fig. 11.6). The details page of the vulnerability is opened by clicking
.Vulnerabilities with an attached note are marked with
 .
Vulnerabilities with an attached ticket are marked with
.
Vulnerabilities with an attached ticket are marked with  .
.Note
If the column of the vulnerability still appears empty the respective NVT has not been updated yet.

Fig. 11.6 Detailed information about the vulnerability
- Solution type

Solution for the found vulnerability. The following the solutions are possible:
 A vendor patch is available.
 A workaround is available.
 A mitigation by configuration is available.
 No fix is and will be available.
 No solution exists.
- Severity
- The severity of the vulnerability (CVSS, see Chapter 13.2.4) is displayed as a bar to support the analysis of the results.
- QoD
QoD is short for Quality of Detection and shows the reliability of the detection of a vulnerability. The QoD was introduced with GOS 3.1. Results created with earlier versions are assigned a QoD of 75 % during migration.
By default, only results that were detected by NVTs with a QoD of 70 % or higher are displayed. The possibility of false positives is thereby lower. The filter can be adjusted to show results with a lower QoD (see Chapter 8.4.1).
- Host
- Host for which the result was found. The IP address and the name of the host are displayed separately.
- Location
- Port number and protocol type used to find the vulnerability on the host.
- Created
- Date and time of the report creation.
11.2.1.2. Interpreting a Report
To interpret the results note the following information:
- False Positives

A false positive is a finding that describes a problem that does not really exist. Vulnerability scanners often find evidence that point at a vulnerability but a final judgment cannot be made. There are two options available:
- Reporting of a potentially non-existent vulnerability (false positive).
- Ignoring reporting of a potentially existing vulnerability (false negative).
Since a user can identify, manage and as such deal with false positives compared to false negatives, the GSM vulnerability scanner reports all potentially existing vulnerabilities. If the user knows that false positives exist an override can be configured (see Chapter 11.8). The AutoFP function (see Chapter 11.8.4) can be used as well.
- False Positives
- Multiple findings can have the same cause.
If an especially old software package is installed, often multiple vulnerabilities exist. Each of these vulnerabilities is tested by an individual NVT and causes an alert. The installation of a current package will remove a lot of vulnerabilities at once.
- High
 and Medium
Findings of the severity levels High and Medium are most important and should be addressed with priority. Before addressing medium level findings, high level findings should get addressed. Only in exceptional cases this approach should be deviated from, e.g. when it is known that the high level findings need to be less considered because the service cannot be reached through the firewall.
- High
- Low
 and Log
Findings of the severity levels Low and Log are mostly interesting for detail understanding. These findings are filtered out by default but can hold very interesting information. Considering them will increase the security of the network and the systems. Often a deeper knowledge of the application is required for their understanding. Typical for a result with the severity Log is that a service uses a banner with its name and version number. This could be useful for an attacker when this version has a known vulnerability.
- Low
11.2.1.3. Filtering a Report
Since a report often contains a lot of findings, the complete report as well as only filtered results can be displayed and downloaded.
The report can be filtered as follows:
Click
in the filter bar.Enter a keyword which should be searched for in the input box Filter (see Fig. 11.7).
For Apply Overrides select the radiobutton Yes to enable overrides (see Chapter 11.8).
For Apply Overrides select the radiobutton No to disable overrides.
For Auto-FP activate the checkbox Trust vendor security updates to apply automatic false positives.
Select the radiobutton Full CVE match for a full or Partial CVE match for a partial match (see Chapter 11.8.4).
Note
If
autofp=1(Full CVE match), all CVEs must be listed as “closed” for the result to be marked as False Positive.If
autofp=2(Partial CVE match), at least one of the CVEs must be listed as “closed” for the result to be marked as False Positive.Activate the checkbox Only show hosts that have results if only the hosts with results should be included.
For QoD select the desired QoD.
For Severity (Class) activate the checkboxes of the desired severity classes.
For Solution Type select the radiobuttons of the desired solution types.
Click Update.
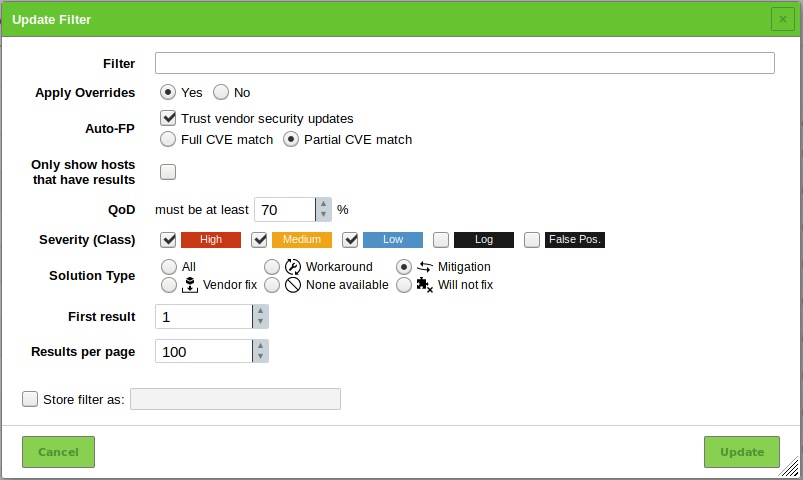
Fig. 11.7 Adjusting the filter for the report
11.2.2. Exporting a Report
For supported export formats see Chapter 11.1.
A report can be exported as follows:
Select Scans > Reports in the menu bar.
Click on the date of a report to open the details page of the report.
Click
.→ The scan report content composer is opened (see Fig. 11.8).
Note
The applied filter is displayed in the input box Filter and cannot be changed. For changing the filter see Chapter 11.2.1.3.
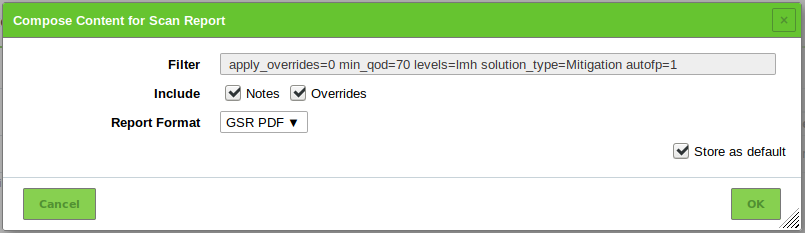
Fig. 11.8 Composing the content of a report export
For Include activate the checkbox Notes to include attached notes and the checkbox Overrides to label enabled overrides and include their text field.
Note
Overrides are only considered if they are enabled when filtering the report (see Chapter 11.2.1.3).
Select the report format in the drop-down-list Report Format.
Activate the checkbox Store as default to save the settings for future exports.
Click OK.
Save the report by clicking Save File.
11.2.3. Importing a Report
Reports can be imported to the GSM as follows:
Select Scans > Reports in the menu bar.
Click
 .
.Click Browse… and select the XML file of a report (see Fig. 11.9).
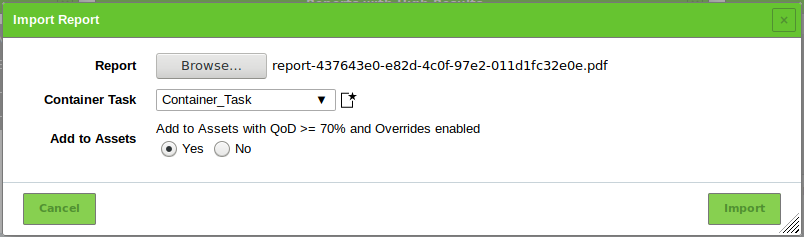
Fig. 11.9 Importing a report
Select the container task to which the report should be added in the drop-down-list Container Task.
Tip
By clicking
a new container task can be created (see Chapter 10.5).Select the radiobutton Yes to add the report to the assets.
Click Import.
11.2.4. Triggering an Alert for a Report
Often an alert includes the sending of a report. The report sent by an alert is subject to a filter defined in the alert content composer (see Chapter 10.12). Triggering an alert for a report adds a second filter originating from the scan report content composer (see Chapter 11.2.2).
The alert can be triggered manually as follows:
Select Scans > Reports in the menu bar.
Click on the date of a report to show the results.
Filter the report so that only the results that should be sent are displayed by using the Powerfilter (see Chapter 11.2.1.3) or selecting a register.
Note
The filter that is configured in the alert content composer (see Chapter 10.12) is applied additionally.
To mimic the behaviour of this filter, adjust the filter of the report in a way that no results are filtered out.
Click
.→ The scan report content composer is opened (see Fig. 11.8).
Note
The applied filter for displaying the results is entered in the input box Filter and cannot be changed. For changing the filter see Chapter 11.2.1.3.
For Include activate the checkbox Notes to include attached notes and the checkbox Overrides to label enabled overrides and include their text field.
Note
Overrides are only considered if they are enabled when filtering the report (see Chapter 11.2.1.3).
Select the alert in the drop-down-list Alert.
Tip
A new alert can be created by clicking
. For the information to enter in the input boxes see Chapter 10.12.Activate the checkbox Store as default to save the settings for future sendings of the report.
Click OK.
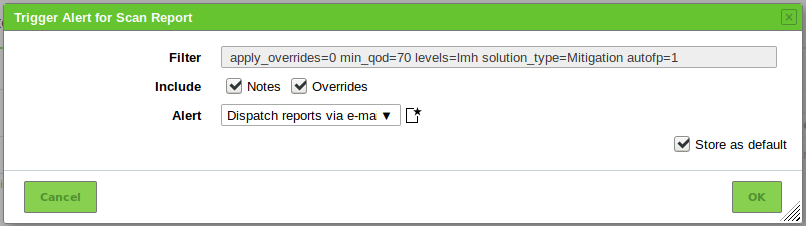
Fig. 11.10 Triggering an alert manually
11.2.5. Creating a Delta Report
If more than one report of a single task is available (see Chapter 11.2) a delta report can be created as follows:
Select Scans > Tasks in the menu bar.
Click on the total number of reports in the column Reports.
→ The page Reports is opened. A filter is applied to show only the reports for the selected task.
Select the first report by clicking
in the column Actions of the respective report (see Fig. 11.11).→ The icon
is grayed out for the selected report.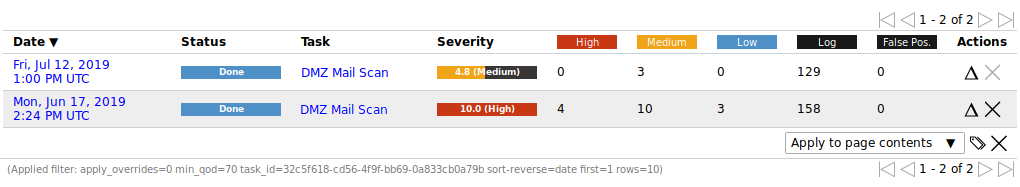
Fig. 11.11 Selecting the first report
Select the second report by clicking
 in the column Actions of the respective report (see Fig. 11.12).
→ The delta report with the delta results is displayed (see Fig. 11.13) and can be exported.
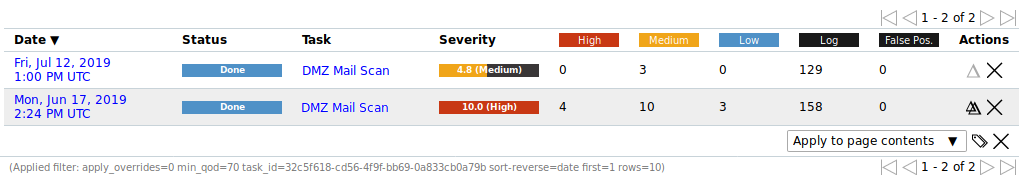
Fig. 11.12 Selecting the second report
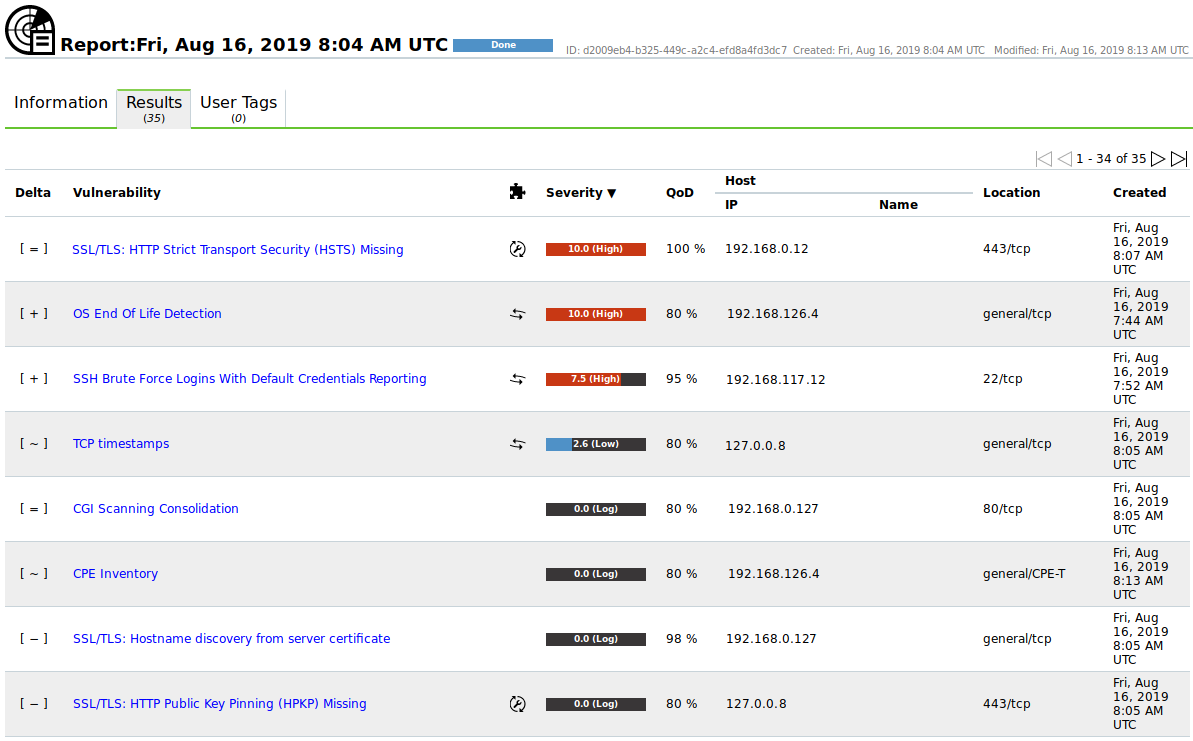
Fig. 11.13 Delta report with delta results
The type of the delta result is displayed in the column Delta. There are four types of delta results:
- Gone [–]
- The result exists in the first report but not in the second report (according to order of selection).
- New [+]
- The result exists in the second report but not in the first report (according to order of selection).
- Same [=]
- The result exists in both reports and is equal.
- Changed [~]
- The result exists in both reports but is different.
Tip
The term delta_states= can be entered into the filter bar to show only a specific type of delta results (see Chapter 8.4).
delta_states=gshows all results of the type Gone.delta_states=nshows all results of the type New.delta_states=sshows all results of the type Same.delta_states=cshows all results of the type Changed.
Multiple types can be displayed at the same time, e.g. delta_states=gs shows all results of the type Gone and Same.
11.3. Displaying all Existing Results
List Page
While the reports only contain the results of one single scan, all results are saved in the internal database and can be viewed by selecting Scans > Results in the menu bar.
Powerfilters can be used to display only interesting results (see Chapter 8.4).
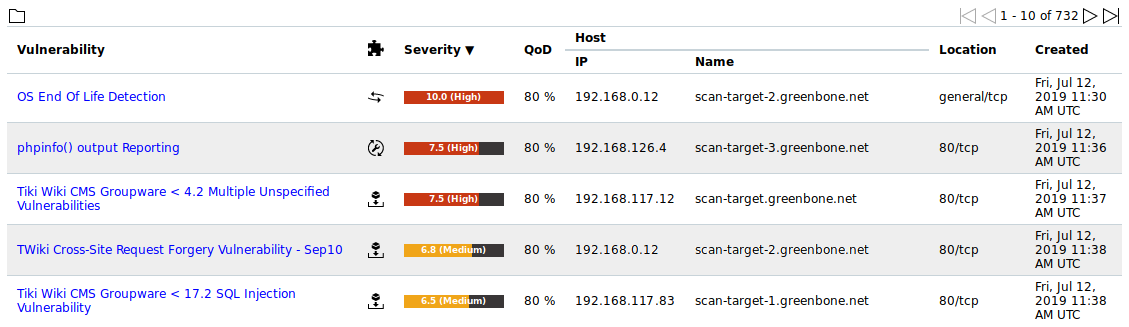
Fig. 11.14 Page Results showing all results of all scans
For all results the following information is displayed:
- Vulnerability
Name of the found vulnerability.
Vulnerabilities with an attached note are marked with
.
Vulnerabilities with an attached ticket are marked with .Note
If the column of the vulnerability still appears empty the respective NVT has not been updated yet.
Note
Even though the results contain a lot of information, external references are always listed in the details.
These refer to web sites on which the vulnerability was already discussed.
Additional background information is available such as who discovered the vulnerability, what effects it could have and how it can be remediated.
- Solution type
To simplify the elimination of vulnerabilities every result offers a solution for problems. The column Solution type displays the existence of a solution. The following the solutions are possible:
- A vendor patch is available.
- A workaround is available.
- A mitigation by configuration is available.
- No fix is and will be available.
- No solution exists.
- Severity
- Severity of the vulnerability. The severity of the vulnerability (CVSS, see Chapter 13.2.4) is displayed as a bar to support the analysis of the results.
- QoD
QoD is short for Quality of Detection and shows the reliability of the detection of a vulnerability. The QoD was introduced with GOS 3.1. Results created with earlier versions are assigned a QoD of 75 % during migration.
By default, only results that were detected by NVTs with a QoD of 70 % or higher are displayed. The possibility of false positives is thereby lower. The filter can be adjusted to show results with a lower QoD (see Chapter 8.4.1).
- Host
- Host for which the result was found. The IP address and the name of the host are displayed separately.
- Location
- Port number and protocol type used to find the result on the host.
- Created
- Date and time of the report creation.
Note
By clicking below the list of results more than one result can be exported at a time. The drop-down-list is used to select which results exported.
Details Page
Click on the name of a result to display the details of the result.
Click to open the details page of the result.
The following registers are available:
- Information
- General information about the result.
- User Tags
- Assigned tags (see Chapter 8.5).
The following actions are available in the upper left corner:
- Open the corresponding chapter of the user manual.
- Show the list page of all results.
- Export the result as an XML file.
 Create a new note for the result (see Chapter 11.7.1).
 Create a new override for the result (see Chapter 11.8.1).
 Create a new ticket for the result (see Chapter 11.6.1).
- Show the corresponding task.
 Show the corresponding report.
11.4. Displaying all Existing Vulnerabilities
List Page
While the reports only contain the vulnerabilities of one single scan, all vulnerabilities are saved in the internal database and can be viewed by selecting Scans > Vulnerabilities in the menu bar.
Powerfilters can be used to display only interesting vulnerabilities (see Chapter 8.4).
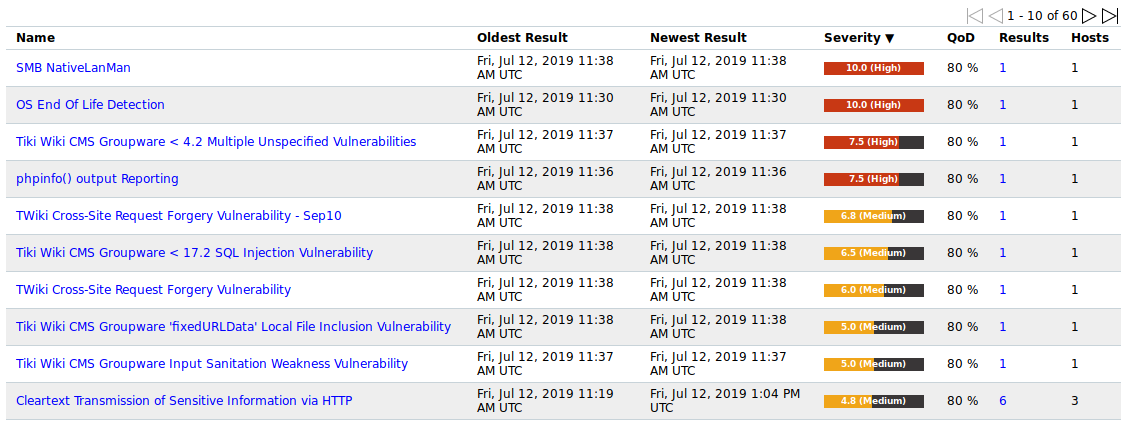
Fig. 11.15 Page Vulnerabilities showing all vulnerabilities of all scans
For all vulnerabilities the following information is displayed:
- Name
- Title of the vulnerability.
- Oldest Result
- Date and time of the oldest result that was found for the vulnerability.
- Newest Result
- Date and time of the newest result that was found for the vulnerability.
- Severity
- Severity of the vulnerability. To support the administrator with the analysis of the results, the severity of a vulnerability (CVSS, see also Chapter 13.2.4) is displayed as a bar.
- QoD
QoD is short for Quality of Detection and shows the reliability of the detection of a vulnerability. The QoD was introduced with GOS 3.1. Results created with earlier versions are assigned a QoD of 75 % during migration.
By default, only vulnerabilities that were detected by NVTs with a QoD of 70 % or higher are displayed. The possibility of false positives is thereby lower. The filter can be adjusted to show results with a lower QoD (see Chapter 8.4.1).
- Results
- Number of results found for this vulnerability. By clicking on the number of results the page Results is opened. A filter is applied to show only the results for the selected vulnerability.
Note
By clicking below the list of results more than one result can be exported at a time. The drop-down-list is used to select which results exported.
Details Page
Click on the name of a vulnerability to open the details page of the vulnerability.
The following actions are available in the upper left corner:
- Open the corresponding chapter of the user manual.
- Show the list page of all vulnerabilities.
- Export the vulnerability as an XML file.
- Create a new note for the vulnerability (see Chapter 11.7.1).
- Create a new override for the vulnerability (see Chapter 11.8.1).
- Show the corresponding results.
- Show the corresponding vulnerability.
11.5. Trend of Vulnerabilities
If a task has been run multiple times the trend of discovered vulnerabilities is displayed on the page Tasks (see Fig. 11.16).
To get there select Scans > Tasks in the menu bar.
The trend describes the change of vulnerabilities between the newest and the second newest report. It is displayed in the column Trend.
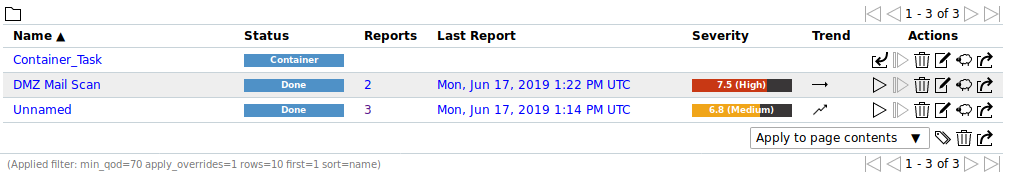
Fig. 11.16 Task with trend
The following trends are possible:
 In the newest report the highest severity is higher than the highest severity in the second newest report.
 The highest severity is the same for both reports. However, the newest report contains more security issues of this severity than the second newest report.
 The highest severity and the amount of security issues are the same for both reports.
 The highest severity is the same for both reports. However, the newest report contains less security issues of this severity than the second newest report.
 In the newest report the highest severity is lower than the highest severity in the second newest report.
11.6. Using Tickets
Users can task other users or themselves to resolve findings of a scan.
11.6.1. Creating a Ticket
A ticket can be created as follows:
Select Scans > Reports in the menu bar and click on the date of a report to show the results.
Click on an item in the column Vulnerability and
to open the details page of the result.or
Select Scans > Results in the menu bar.
Click on an item in the column Vulnerability and
to open the details page of the result.Create a new ticket by clicking
.Select the user to whom the ticket should be assigned in the drop-down-list Assign to User (see Fig. 11.17).
Enter a note for the ticket in the input box Note.
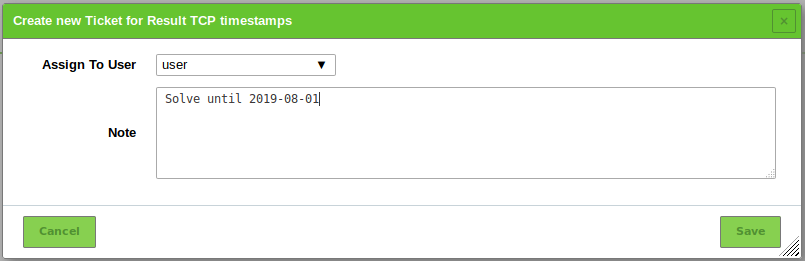
Fig. 11.17 Creating a new ticket
Click Save.
→ The number of tickets for a result are displayed in the upper left corner of the details page of the result (see Fig. 11.18). By clicking
the corresponding tickets are displayed.
Fig. 11.18 Number of assigned tickets
11.6.2. Changing the Status of a Ticket
A ticket can have the following status:
- Open: the vulnerability has not been fixed yet.
- Fixed: the vulnerability has been fixed.
- Fixed verified: the task has been run again and the vulnerability was not found anymore. This status is set automatically.
- Closed: the fix of the vulnerability was verified or the ticket is not required anymore.
The status of a ticket can be changed as follows:
Select Scans > Remediation Tickets in the menu bar.
In the row of the ticket click
.Select the new status in the drop-down-list Status (see Fig. 11.19).
Select the user to whom the ticket with the new status should be assigned in the drop-down-list Assigned User.
Enter a note for the new status in the respective input box.
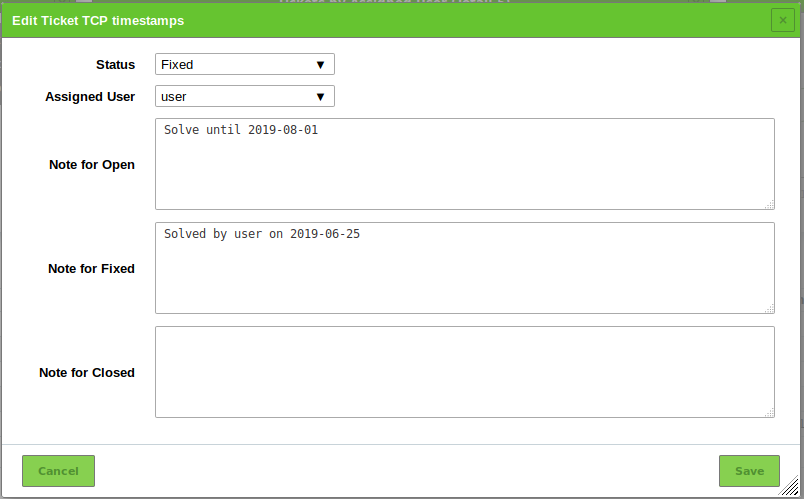
Fig. 11.19 Changing the status of a ticket
Click Save.
11.6.3. Setting an Alert for a Ticket
Alerts for tickets can be set for the following events:
- A new ticket is received.
- The status of an assigned ticket changed.
- The status of an own ticket changed.
An alert for tickets is set up as follows:
Select Configuration > Alerts in the menu bar.
Create a new alert by clicking
.Define the alert (see Fig. 11.20).
Click Save.
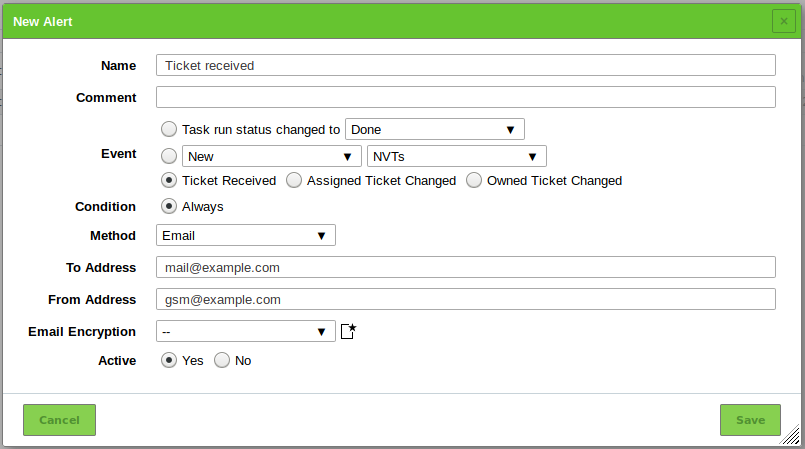
Fig. 11.20 Setting an alert for a ticket
The following details of the alert can be defined:
- Name
- Definition of the name. The name can be chosen freely.
- Comment
- An optional comment can contain additional information.
- Event
Select Ticket Received if an alert should be sent when a new ticket is assigned to oneself.
Select Assigned Ticket Changed if an alert should be sent when the status of a ticket assigned to oneself changes.
Select Owned Ticket Changed if an alert should be sent when the status of ticket assigned to another user changes.
- Method
Selection of the method for the alert. Only one method per alert can be chosen.
If different alerts for the same event should be triggered, multiple alerts must be created and linked to the same task.
The following methods are possible:
An e-mail is sent to the given address.
The transmission of the e-mail can by encrypted using a configurable S/MIME or GPG key. The encryption can be selected in the drop-down-list Email Encryption or created by clicking
.- Start Task
- The alert can start an additional task. The task is selected in the drop-down-list Start Task.
- System Logger
The alert is sent to a Syslog daemon.
The Syslog server is defined using the console (see Chapter 7.2.11).
11.6.4. Managing Tickets
List Page
All existing tickets can be displayed by selecting Scans > Remediation Tickets in the menu bar.
For all tickets the following information is displayed:
- Vulnerability
- Vulnerability for which the ticket is created.
- Severity
- Severity of the vulnerability for which the ticket is created.
- Host
- Host on which the vulnerability was found.
- Solution Type
- Solution type of the vulnerability for which the ticket is created.
- Assigned User
- User to which the ticket is assigned.
- Modification Time
- Date and time of the last modification of the ticket.
- Status
- Status of the ticket.
For all tickets the following actions are available:
- Delete the ticket.
- Edit the ticket.
 Clone the ticket.
Note
By clicking or below the list of tickets more than one ticket can be deleted or exported at a time. The drop-down-list is used to select which ticket are deleted or exported.
Details Page
Click on the name of a ticket to display the details of the ticket.
Click to open the details page of the ticket.
The following registers are available:
- Information
- General information about the ticket.
- User Tags
- Assigned tags (see Chapter 8.5).
The following actions are available in the upper left corner:
- Open the corresponding chapter of the user manual.
- Show the list page of all tickets.
- Clone the ticket.
- Edit the ticket.
- Delete the ticket.
- Export the ticket as an XML file.
11.7. Using Notes
Notes allow adding comments to an NVT and are displayed in the reports as well. A note can be added to a specific result, task, severity, port or host and as such will only appear in specific reports. A note can be generalized as well so that it will be displayed in all reports.
11.7.1. Creating a Note
11.7.1.1. Creating a Note Through a Scan Result
Notes can be created in different ways. The simplest way is through the respective scan result in a report:
Select Scans > Reports in the menu bar.
Click on the date of the report to show the results.
Select the register Results.
Click on a result in the column Vulnerability.
Click
to to open the details page of the result.Click
in the upper left corner of the page.Define the note.
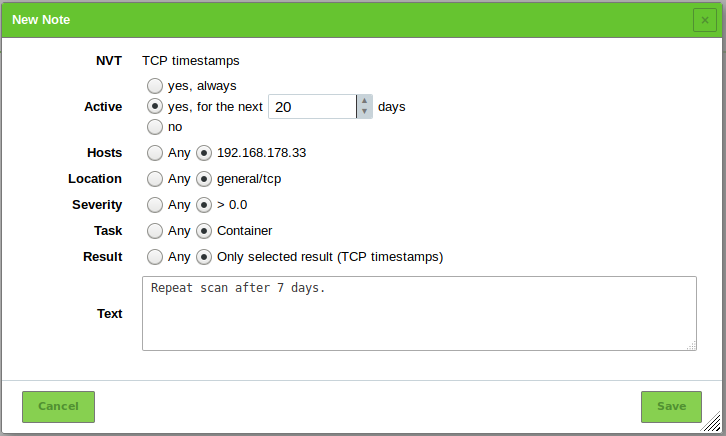
Fig. 11.21 Creating a new note
Click Save.
→ The note is displayed on the details page of the result (see Fig. 11.22).
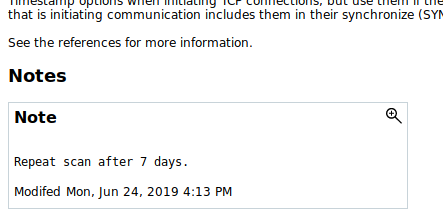
Fig. 11.22 Report containing a note
11.7.1.2. Creating a Note on the Page Notes
Notes can be created on the page Notes as well:
Select Scans > Notes in the menu bar.
Create a new note by clicking
.Enter the ID of the NVT in the input box NVT OID.
Define the note.
Tip
It is possible to enter ranges of IP addresses and CIDR blocks in the input box Hosts. In that way, notes for entire subnets can be created without having to specify every host in a comma-separated list.
Notes can be generalized by selecting the radiobutton Any for hosts, locations, severities, tasks or results.
Click Save.
11.7.2. Managing Notes
List Page
All existing notes can be displayed by selecting Scans > Notes in the menu bar.
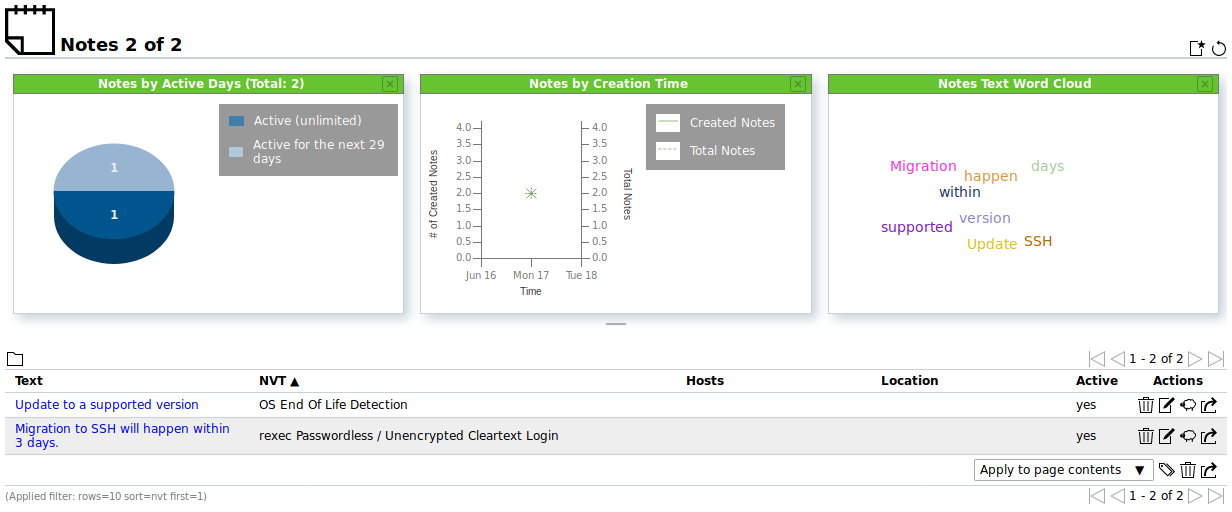
Fig. 11.23 Managing notes
For all notes the following actions are available:
- Delete the note.
- Edit the note.
- Clone the note.
- Export the note as an XML file.
Note
By clicking or below the list of notes more than one note can be deleted or exported at a time. The drop-down-list is used to select which notes are deleted or exported.
Details Page
Click on the name of a note to display the details of the note.
Click to open the details page of the note.
The following registers are available:
- Information
- General information about the note.
- User Tags
- Assigned tags (see Chapter 8.5).
- Permissions
- Assigned permissions (see Chapter 9.4).
The following actions are available in the upper left corner:
- Open the corresponding chapter of the user manual.
- Show the list page of all notes.
- Create a new note (see Chapter 11.7.1).
- Clone the note.
- Edit the note.
- Delete the note.
- Export the note as an XML file.
11.8. Using Overrides and False Positives
The severity of a result can be modified. This is called override.
Overrides are especially useful to manage results that are detected as a false positive and that have been given a critical severity but should be given a different severity in the future.
The same applies to results that only have been given the severity Log but should be assigned a higher severity locally. This can be managed with an override as well.
Overrides are also used to manage acceptable risks.
11.8.1. Creating an Override
11.8.1.1. Creating an Override Through a Scan Result
Overrides can be created in different ways. The simplest way is through the respective scan result in a report:
Select Scans > Reports in the menu bar.
Click on the date of the report to show the results.
Select the register Results.
Click on a result in the column Vulnerability.
Click
to to open the details page of the result.Click
in the upper left corner of the page.Define the override. Select the new severity in the drop-down-list New Severity (see Fig. 11.24).
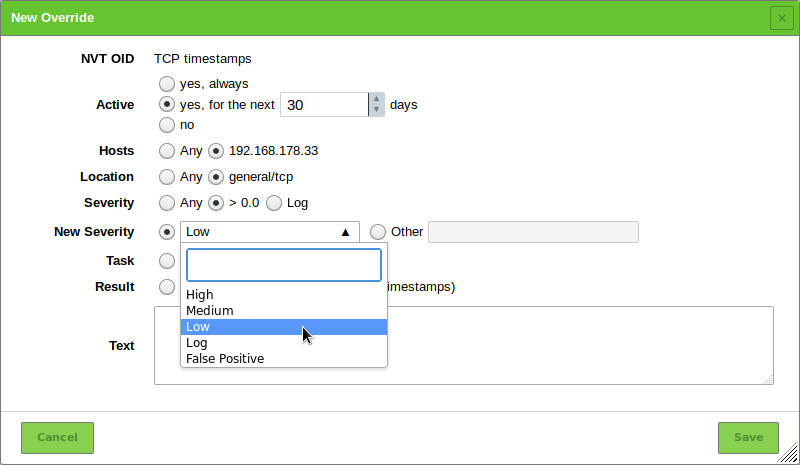
Fig. 11.24 Creating a new override
Click Save.
The following information can be entered:
Note
If an override is created through a scan result, some settings are already filled in.
- NVT
- NVT for which the override is applied.
- Active
- Selection whether the override should be activated. An activation for an arbitrary number of days is possible as well.
- Hosts
Host or range of hosts for which the result must be found for the override to apply.
Tip
It is possible to enter ranges of IP addresses and CIDR blocks. In that way, overrides for entire subnets can be created without having to specify every host in a comma-separated list.
Host ranges are specified with a minus, e.g.
198.168.1.1-198.168.1.25. A range bigger than 4096 is not supported.Note
Conflicting overrides, e.g. an override for a host range and another override for a host inside that range, are not permitted.
- Location
- Port for which the result must be found for the override to apply.
Only a specific port or the setting Any are supported per override.
A specific port must be supplied as a number followed by
/tcpor/udp. - Severity
- Range of severity of the NVT for which the overrides should be applied.
- New Severity
- Severity the NVT should have after the override is applied.
- Task
- Selection of tasks for which the override should be applied.
- Result
Selection of results for which the override should be applied.
Note
The radiobutton Any has to be selected if the override should be applied to reports in the future.
- Text
- A text describes the override in more detail.
Note
If several overrides apply to the same NVT in the same report the most recent override is used and applied.
11.8.1.2. Creating an Override on the Page Overrides
Overrides can be created on the page Overrides as well:
Select Scans > Overrides in the menu bar.
Create a new override by clicking
.Enter the ID of the NVT in the input box NVT OID.
Define the override.
Note
For the information to enter in the input boxes see Chapter 11.8.1.1.
Select the new severity in the drop-down-list New Severity.
Click Save.
11.8.2. Managing Overrides
List Page
All existing overrides can be displayed by selecting Scans > Overrides in the menu bar.
For all overrides the following actions are available:
- Delete the override.
- Edit the override.
- Clone the override.
- Export the override as an XML file.
Details Page
Click on the name of an override to display the details of the override.
Click to open the details page of the override.
The following registers are available:
- Information
- General information about the override.
- User Tags
- Assigned tags (see Chapter 8.5).
- Permissions
- Assigned permissions (see Chapter 9.4).
The following actions are available in the upper left corner:
- Open the corresponding chapter of the user manual.
- Show the list page of all overrides.
- Create a new override (see Chapter 11.8.1).
- Clone the override.
- Edit the override.
- Delete the override.
- Export the override as an XML file.
11.8.3. Disabling and Enabling Overrides
If overrides change the display of the results, the overrides can be enabled or disabled.
This is done by setting the filter as follows:
Click
in the filter bar.For Apply Overrides select the radiobutton Yes to enable overrides.
For Apply Overrides select the radiobutton No to disable overrides.
Click Update.
Tip
Overrides can be labelled in exported reports (see Chapter 11.2.2).
11.8.4. Automatic False Positives
The GSM is able to detect false positives and assign an override automatically. However, the target system must be analyzed internally and externally with an authenticated scan (see Chapter 10.3).
An authenticated scan can identify vulnerabilities in locally installed software. Vulnerabilities that can be exploited by local users or are available to an attacker if the attacker already gained local access as an unprivileged user can be identified. In many cases an attack occurs in different phases and an attacker exploits multiple vulnerabilities to increase his privileges.
An authenticated scan offers a second more powerful function justifying its execution. By scanning the system externally, it often cannot be properly identified if a vulnerability really exists. The Greenbone Security Manager reports all potential vulnerabilities. With the authenticated scan many potential vulnerabilities can be recognized and filtered as false positives.
Automatic false positives are enabled when filtering a report (see Chapter 11.2.1.3).
There are two possible settings for automatic false positives:
- Full CVE match (
autofp=1) - Partial CVE match (
autofp=2)
Automatic false positives work as follows:
Sometimes, one Vulnerability Test (VT) (VT A) detects a vulnerability but another VT (VT B) is able to verify that this vulnerability has already been resolved.
→ All CVEs listed in VT B are listed as Closed CVE in the host details.
For every result that was not detected with a VT from a Local Security Checks family, consider the CVEs mentioned.
Note
VTs of the Local Security Checks families are considered to be authoritative meaning a result from these families can never be a false positive.
For every CVE associated with the result, check if the CVE is listed as Closed CVE in the host details.
If
autofp=1(Full CVE match), all CVEs must be listed as “closed” for the result to be marked as False Positive.If
autofp=2(Partial CVE match), at least one of the CVEs must be listed as “closed” for the result to be marked as False Positive.
Note
Due to the complexity of determining false positives, activating automatic false positives in the filter can make the filtering slow, especially with large result sets.