 English |
11 Reports and Vulnerability Management
Note
This chapter documents all possible menu options.
However, not all appliance models support all of these menu options. Check the tables in Chapter 3 to see whether a specific feature is available for the used appliance model.
The results of a scan are summarized in a report. Reports can be displayed on the web interface and downloaded in different formats.
The appliance saves all reports of all scans in a local database. Not only is the last report of a scan saved but all reports of all scans ever run. This allows access to information from the past. The reports contain the discovered vulnerabilities and information of a scan.
Once a scan has been started, the report of the results found so far can be viewed. When a scan is completed, the status changes to Done and no more results will be added.
11.1 Configuring and Managing Report Formats
Report formats are defined as the formats a report is created from, based on the scan results. Many report formats reduce the available data in order to display it in a meaningful way.
The report formats can be used to export report information into other document formats, so they can be processed by other third-party applications (connectors).
The name of the exported report is configurable in the user settings (see Chapter 8.7).
The native appliance XML format contains all data and can be used to import exported reports on another appliance. To do so, create a container task (see Chapter 10.5).
11.1.1 Default Report Formats
All default report formats by Greenbone are data objects that are distributed via the feed. They are downloaded and updated with each feed update.
If no default report formats are available, a feed update may be necessary, or the Feed Import Owner may need to be set (see Chapter 7.2.1.9.1).
Default report formats cannot be edited. Furthermore, they can only be deleted temporarily by the Feed Import Owner or by a super administrator. During the next feed update, they will be downloaded again.
Note
To permanently delete a default report format, the Feed Import Owner has to delete it. Afterwards the Feed Import Owner has to be changed to (Unset) (see Chapter 7.2.1.9.1).
By default, the following report formats are available:
- Anonymous XML
- This is the anonymous version of the XML format. IP addresses are replaced by random IP addresses.
- ARF: Asset Reporting Format v1.0.0
- This format creates a report that represents the NIST Asset Reporting Format.
- CPE – Common Platform Enumeration CSV Table
- This report selects all CPE tables and creates a single comma-separated file.
- CSV Hosts
- This report creates a comma-separated file containing the systems discovered.
- CSV Results
- This report creates a comma-separated file with the results of a scan.
- GCR PDF – Greenbone Compliance Report
- This is the complete Greenbone Compliance Report for compliance audits (see Chapter 12.2) with all vulnerabilities in graphical format as a PDF file. The language of the report is English.
- GSR HTML – Greenbone Security Report
- This is the complete Greenbone Security Report with all vulnerabilities and results. It can be opened with a web browser in which JavaScript must be enabled. It contains dynamically sortable lists as known from the web interface. The language of the report is English.
- GSR PDF – Greenbone Security Report
- This is the complete Greenbone Security Report with all vulnerabilities in graphical format as a PDF file. The topology graph is not included if more than 100 hosts are covered in the report. The language of the report is English.
- GXCR PDF – Greenbone Executive Compliance Report
- This is the shortened Greenbone Compliance Report for compliance audits (see Chapter 12.2) with all vulnerabilities in graphical format as a PDF file for management. The language of the report is English.
- GXR PDF – Greenbone Executive Report
- This is the shortened Greenbone Security Report with all vulnerabilities in graphical format as a PDF file for management. The topology graph is not included if more than 100 hosts are covered in the report. The language of the report is English.
- ITG – IT-Grundschutz catalog
- This report is guided by the BSI IT-Grundschutz catalog. It provides an overview of the discovered results in tabular view in CSV format. The language of the report is German.
- LaTeX
- This report is offered as LaTeX source text. The language of the report is English.
- NBE
- This is the old OpenVAS/Nessus report format. It does not have support for notes, overrides and some additional information.
- This is a complete report in PDF. Like the HTML format it is neutral. The language of the report is English.
- TLS Map
- This is the report format for TLS Map scans (see Chapter 12.6).
- Topology SVG
- This presents the results in an SVG picture.
- TXT
- This creates a text file. This format is especially useful when being sent by e-mail. The language of the report is English.
- Verinice ISM
- Creates an import file for the ISMS tool verinice (see Chapter 18.2).
- Verinice ISM all results
- Creates an import file for the ISMS tool verinice (see Chapter 18.2).
- Verinice ITG (obsolete)
- Creates an import file for the ISMS tool verinice (see Chapter 18.2).
- Vulnerability Report HTML (recommended)
- This is the new complete Greenbone Security Report with all vulnerabilities and results. It can be opened with a web browser or HTML viewer. The language of the report is English.
- Vulnerability Report PDF (recommended)
This is the new complete Greenbone Security Report with all vulnerabilities in graphical format as a PDF file. The language of the report is English.
Reports with this report format are limited to the first 500 results per host. Subsequent results per host will be left out and a warning will be shown on the title page of the report.
- XML
- The report is exported in the native XML format. Contrary to the other formats this format contains all results and does not format them at all.
11.1.2 Managing Report Formats
List Page
All existing report formats can be displayed by selecting Configuration > Report Formats in the menu bar.
For all report formats the following information is displayed:
- Name
- Name of the report format.
- Extension
- The file name of the downloaded report consists of the UUID (unique internal ID of the report) and this extension. Among others, the extension supports the browser to start a compatible application in case the specified content type is not recognized.
- Content Type
The content type specifies the format in use and is transmitted when being downloaded. By this, a compatible application can be launched by the browser.
Additionally, the content type is important internally: it is used to offer suitable plug-ins within its context. For example, when sending a report via e-mail all plug-ins of the type
text/\*are offered as they can be embedded in an e-mail in a humanly readable way.- Trust
- Some report formats only convert data, while others perform more complex operations and also execute programs. To prevent abuse, each report format plug-in has to be digitally signed by Greenbone. The digital signatures are distributed via the Greenbone Enterprise Feed. If a signature is authentic and the publisher is trusted, it is ensured that the report format exists in the exact format as certified by the publisher. The trust check is automatic and the result can be seen in the column Trust (Last Verified).
- Active
- The report formats are only available in the respective selection menus if they are activated. Newly imported report formats are always deactivated at first. A report format can only be activated if it is trusted.
For all report formats the following actions are available:
 Move the report format to the trashcan. As long as the report format is not deleted from the trashcan, it is not downloaded anew during the next feed update.
 Edit the report format. Only self-created report formats can be edited.
Note
By clicking below the list of report formats more than one report format can be moved to the trashcan at a time. The drop-down list is used to select which report formats are moved to the trashcan.
Details Page
Click on the name of a report format to display the details of the report format.
Click  to open the details page of the report format.
The following actions are available in the upper left corner:
 Open the corresponding chapter of the user manual.
 Show the list page of all report formats.
 Add a new report format (see Chapter 11.1.3).
- Edit the report format. Only self-created report formats can be edited.
 Move the report format to the trashcan. As long as the report format is not deleted from the trashcan, it is not downloaded anew during the next feed update.
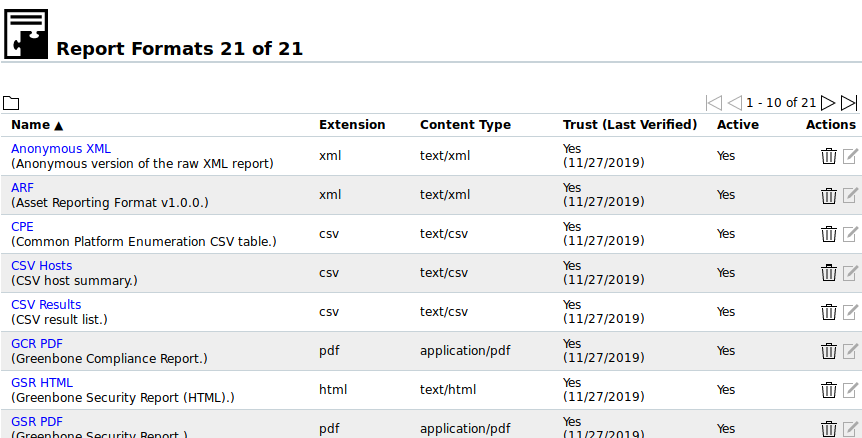
Fig. 11.1 Page Report Formats displaying all available report formats
11.1.3 Adding a Report Format
Note
To prevent abuse, all additionally imported report formats have to be reviewed and digitally signed by Greenbone. Report formats that are not signed by Greenbone are not supported in GOS, and cannot be used.
For more information see Chapter 11.1.2 – Trust.
A new report format can be imported as follows:
Provide or obtain a report format plug-in that has been reviewed and accepted by Greenbone.
Select Configuration > Report Formats in the menu bar.
Click
 .
.Click Browse… and select the report format plug-in (see Fig. 11.2).
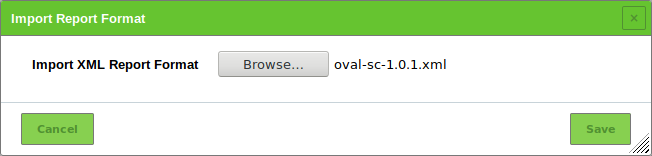
Fig. 11.2 Importing a report format plug-in
Click Save.
→ The imported report format is displayed on the page Report Formats.
In the row of the report format, click
.For Active select the radio button Yes (see Fig. 11.3).
Click Save.
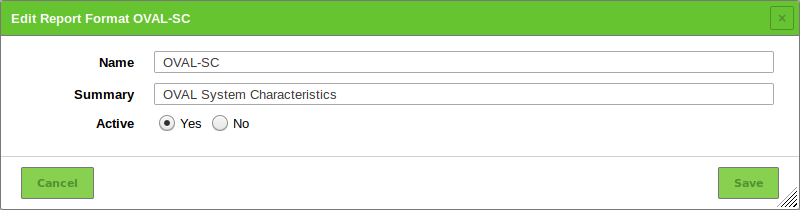
Fig. 11.3 Activating a new report format
11.2 Using and Managing Reports
All existing reports for all scans can be displayed by selecting Scans > Reports in the menu bar.
The total number of reports of a specific task is displayed on the page Tasks in the column Reports.
The reports for a specific task can be displayed as follows:
Select Scans > Tasks in the menu bar.
For the desired task click on the total number of reports in the column Reports to display all reports.
→ The page Reports is opened. A filter is applied to show only the reports for the selected task.
Tip
By clicking on the date in the column Last Report the details page of the latest report is opened (see Chapter 11.2.1).
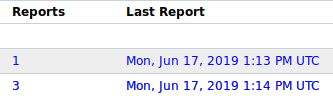
Fig. 11.4 Number of reports saved in total and date of the last report
For every report the following information is displayed:
- Date
- Date and time of report creation.
- Status
- Status of the corresponding task.
- Task
- Corresponding task.
- Severity
- Highest severity found by the scan.
- High/Medium/Low/Log/False Pos.
- Number of found vulnerabilities for each severity.
For all reports the following actions are available:
 Create a delta report (see Chapter 11.2.5).
- Delete the report.
Note
By clicking below the list of reports more than one report can be deleted at a time. The drop-down list is used to select which reports are deleted.
11.2.1 Reading a Report
Click on the date of a report to display the details of the report.
The following registers are available:
- Information
- General information about the corresponding scan.
- Results
- List of all results in this report (see Chapter 11.2.1.1).
- Hosts
- Scanned hosts with host names and IP addresses. The detected operating systems, the number of found vulnerabilities for each severity and the highest severity found by the scan are displayed.
- Ports
- Scanned ports with port name, number of hosts and highest severity found by the scan.
- Applications
- Scanned applications with CPE of the application, number of hosts, number of occurrences of results that detected this CPE and highest severity found by the scan.
- Operating Systems
- Scanned operating systems with system name, host name, number of scanned hosts and highest severity found by the scan.
- CVEs
- CVEs found with the scan.
- Closed CVEs
- CVEs of originally detected vulnerabilities which were already confirmed as solved during the scan.
- TLS Certificates
- TLS certificates found with the scan.
- Error Messages
- Error messages that occurred during the scan.
- User Tags
- Assigned tags (see Chapter 8.4).
The report content can be sorted by a chosen column by clicking on the column title. The content can be sorted ascending or descending:
 in the column title shows that the objects are sorted ascending.
 in the column title shows that the objects are sorted descending.
The following actions are available in the upper left corner:
- Open the corresponding chapter of the user manual.
- Show the list page of all report formats.
 Add the report contents that have at least a QoD of 70 % and enabled overrides to the assets.
 Remove the report contents from the assets.
 Show the corresponding task.
 Open the page Results. A filter is applied to show only the results for this report.
 Open the page Vulnerabilities. A filter is applied to show only the vulnerabilities for this report.
 Open the page TLS Certificates. A filter is applied to show only the TLS certificates for this report.
 Open the page Performance. The system performance for the scan’s duration is displayed.
 Download a filtered report (see Chapter 11.2.2).
 Trigger an alert to send a report (see Chapter 11.2.4).
11.2.1.1 Results of a Report
The register Results contains a list of all vulnerabilities detected by the appliance (see Fig. 11.5).
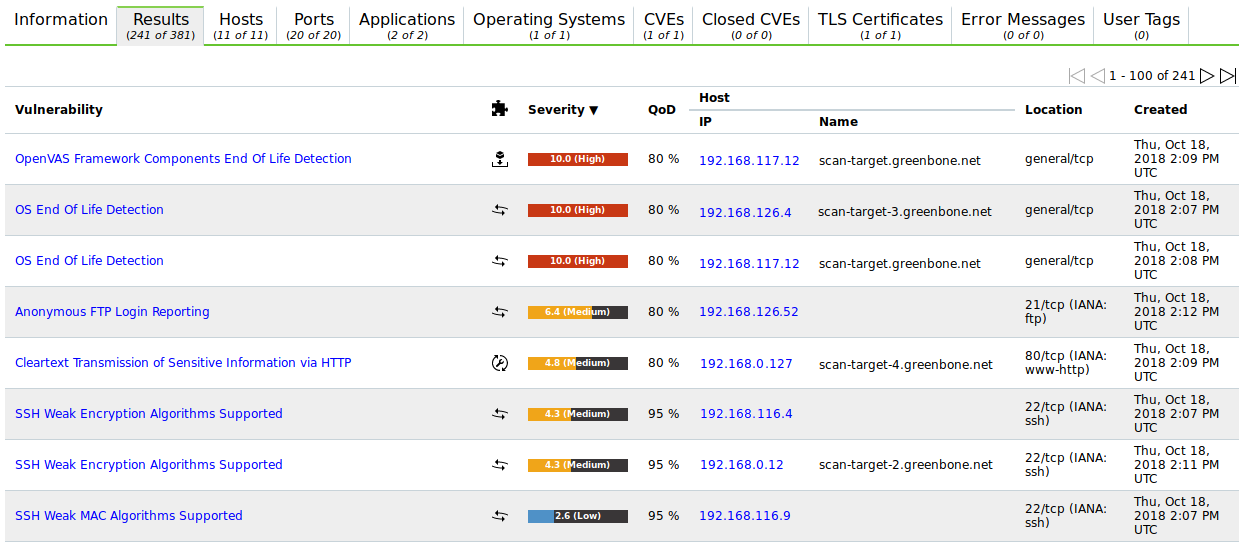
Fig. 11.5 Register Results showing a list of discovered vulnerabilities
Note
By default, overrides are not applied. They can be applied by filtering the report (see Chapter 11.2.1.3).
For every result the following information is displayed:
- Vulnerability
Name of the found vulnerability. By clicking on the name of a vulnerability details of the vulnerability are shown (see Fig. 11.6). The details page of the vulnerability is opened by clicking
.Vulnerabilities with an attached note are marked with
 .
Vulnerabilities with an attached ticket are marked with
.
Vulnerabilities with an attached ticket are marked with  .
.Note
If the column of the vulnerability still appears empty the respective VT has not been updated yet.
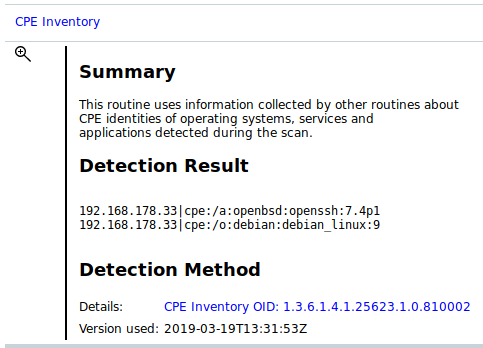
Fig. 11.6 Detailed information about the vulnerability
- Solution type

Solution for the found vulnerability. The following the solutions are possible:
 A vendor patch is available.
 A workaround is available.
 A mitigation by configuration is available.
 No fix is and will be available.
 No solution exists.
- Severity
- The severity of the vulnerability (CVSS, see Chapter 14.2.4) is displayed as a bar to support the analysis of the results.
- QoD
The quality of detection (QoD) is a value between 0 % and 100 % describing the reliability of the executed vulnerability detection or product detection.
By default, only results that were detected by VTs with a QoD of 70 % or higher are displayed. The filter can be adjusted to show results with a lower QoD (see Chapter 8.3.1).
For more information about the QoD see Chapter 11.2.6.
- Host
- Host for which the result was found. The IP address and the name of the host are displayed separately.
- Location
- Port number and protocol type used to find the vulnerability on the host.
- Created
- Date and time of the report creation.
11.2.1.2 Interpreting a Report
To interpret the results note the following information:
- False Positives

A false positive is a finding that describes a problem that does not really exist. Vulnerability scanners often find evidence that point at a vulnerability but a final judgment cannot be made. There are two options available:
- Reporting of a potentially non-existent vulnerability (false positive).
- Ignoring reporting of a potentially existing vulnerability (false negative).
Since a human is able to recognize false positives and thus manage and deal with them – which is not the case for false negatives – the appliance’s vulnerability scanner reports all potentially existing vulnerabilities. If false positive messages are known to exist, an override can be configured (see Chapter 11.8).
- False Positives
- Multiple findings can have the same cause.
If an especially old software package is installed, often multiple vulnerabilities exist. Each of these vulnerabilities is tested by an individual VT and causes an alert. The installation of a current package will remove a lot of vulnerabilities at once.
- High
 and Medium
Findings of the severity levels High and Medium are most important and should be addressed with priority. Before addressing medium level findings, high level findings should get addressed. Only in exceptional cases this approach should be deviated from, e.g., if it is known that the high level findings need to be less considered because the service cannot be reached through the firewall.
- High
- Low
 and Log
Findings of the severity levels Low and Log are mostly interesting for detail understanding. These findings are filtered out by default but can hold very interesting information. Considering them will increase the security of the network and the systems. Often a deeper knowledge of the application is required for their understanding. Typical for a result with the severity Log is that a service uses a banner with its name and version number. This could be useful for an attacker when this version has a known vulnerability.
- Low
11.2.1.3 Filtering a Report
Since a report often contains a lot of findings, the complete report as well as only filtered results can be displayed and downloaded.
The report can be filtered as follows:
- Click in the filter bar.
- Enter a keyword which should be searched for in the input box Filter (see Fig. 11.7).
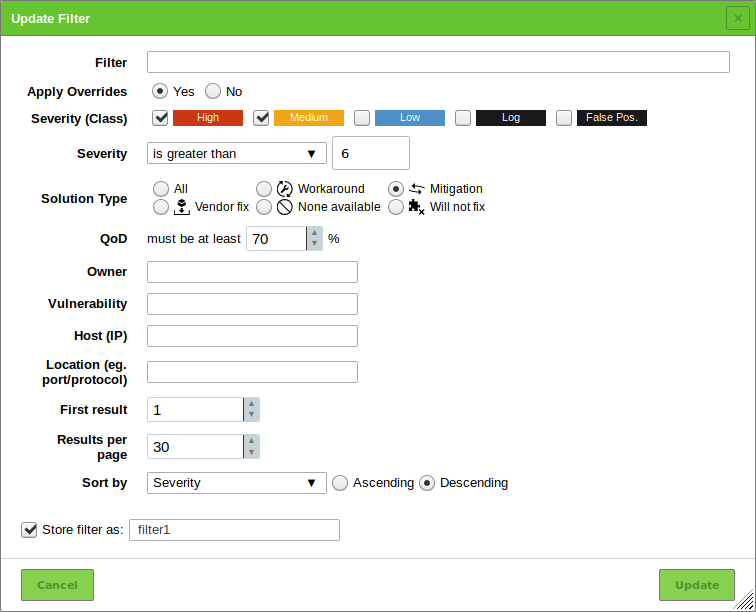
Fig. 11.7 Adjusting the filter for the report
For Apply Overrides select the radio button Yes to enable overrides (see Chapter 11.8).
For Apply Overrides select the radio button No to disable overrides.
Activate the checkbox Only show hosts that have results if only the hosts with results should be included.
For QoD select the desired QoD (see Chapter 11.2.6).
For Severity (Class) activate the checkboxes of the desired severity classes.
For Solution Type select the radio buttons of the desired solution types.
Enter the (part of a) vulnerability’s name, host or location in the according input box.
Click Update.
11.2.2 Exporting a Report
For supported export formats see Chapter 11.1.
A report can be exported as follows:
Select Scans > Reports in the menu bar.
Click on the date of a report to open the details page of the report.
Click
.→ The scan report content composer is opened (see Fig. 11.8).
Note
The applied filter is displayed in the input box Filter and cannot be changed. For changing the filter see Chapter 11.2.1.3.
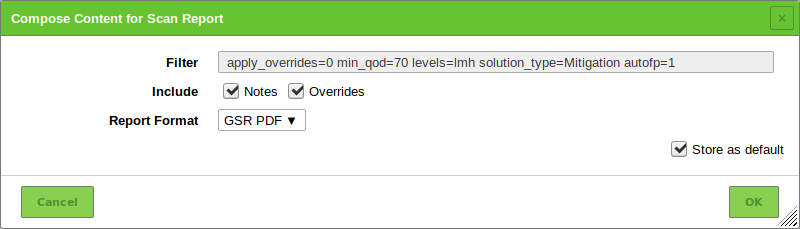
Fig. 11.8 Composing the content of a report export
For Include activate the checkbox Notes to include attached notes and the checkbox Overrides to label enabled overrides and include their text field.
Note
Overrides are only considered if they are enabled when filtering the report (see Chapter 11.2.1.3).
Select the report format in the drop-down list Report Format.
Activate the checkbox Store as default to save the settings for future exports.
Click OK.
Save the report by clicking Save File.
11.2.3 Importing a Report
Reports can be imported to the appliance as follows:
Select Scans > Reports in the menu bar.
Click
 .
.Click Browse… and select the XML file of a report (see Fig. 11.9).
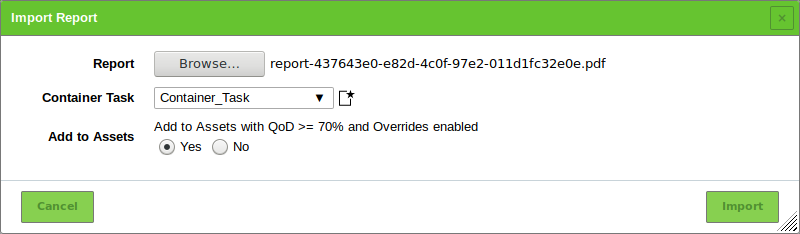
Fig. 11.9 Importing a report
Select the container task to which the report should be added in the drop-down list Container Task.
Tip
By clicking
a new container task can be created (see Chapter 10.5).Select the radio button Yes to add the report to the assets.
Click Import.
11.2.4 Triggering an Alert for a Report
Often an alert includes the sending of a report. The report sent by an alert is subject to a filter defined in the alert content composer (see Chapter 10.12). Triggering an alert for a report adds a second filter originating from the scan report content composer (see Chapter 11.2.2).
The alert can be triggered manually as follows:
Select Scans > Reports in the menu bar.
Click on the date of a report to show the results.
Filter the report so that only the results that should be sent are displayed by using the Powerfilter (see Chapter 11.2.1.3) or selecting a register.
Note
The filter that is configured in the alert content composer (see Chapter 10.12) is applied additionally.
To mimic the behavior of this filter, adjust the filter of the report in a way that no results are filtered out.
Click
.→ The scan report content composer is opened (see Fig. 11.8).
Note
The applied filter for displaying the results is entered in the input box Filter and cannot be changed. For changing the filter see Chapter 11.2.1.3.
For Include activate the checkbox Notes to include attached notes and the checkbox Overrides to label enabled overrides and include their text field.
Note
Overrides are only considered if they are enabled when filtering the report (see Chapter 11.2.1.3).
Select the alert in the drop-down list Alert.
Tip
A new alert can be created by clicking
. For the information to enter in the input boxes see Chapter 10.12.Activate the checkbox Store as default to save the settings for future sendings of the report.
Click OK.
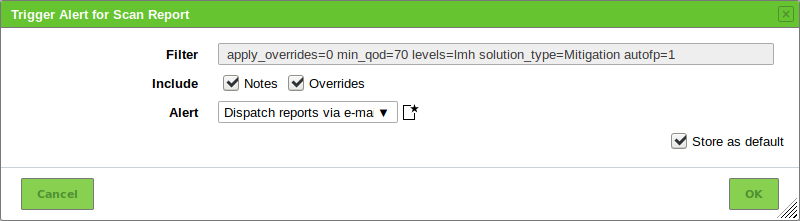
Fig. 11.10 Triggering an alert manually
11.2.5 Creating a Delta Report
If more than one report of a single task is available (see Chapter 11.2) a delta report can be created as follows:
Select Scans > Tasks in the menu bar.
Click on the total number of reports in the column Reports.
→ The page Reports is opened. A filter is applied to show only the reports for the selected task.
Select the first report by clicking
in the column Actions of the respective report (see Fig. 11.11).→ The icon
is grayed out for the selected report.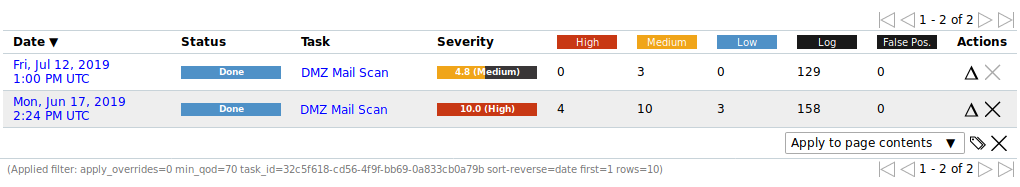
Fig. 11.11 Selecting the first report
Select the second report by clicking
 in the column Actions of the respective report (see Fig. 11.12).
→ The delta report with the delta results is displayed (see Fig. 11.13) and can be exported.
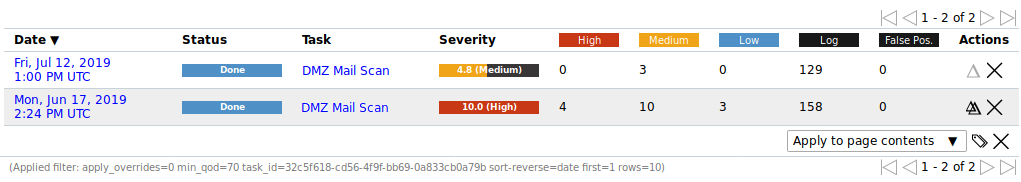
Fig. 11.12 Selecting the second report
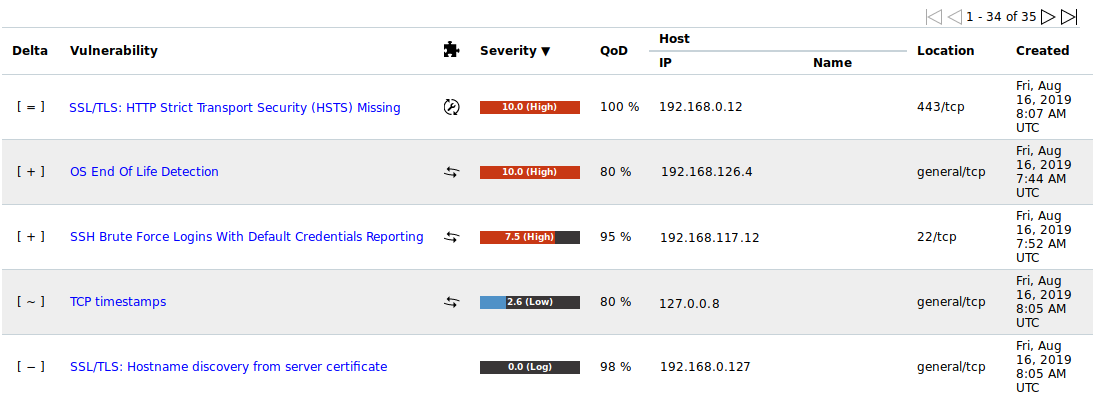
Fig. 11.13 Delta report with delta results
The type of the delta result is displayed in the column Delta. There are four types of delta results:
- Gone [–]
- The result exists in the first report but not in the second report (according to order of selection).
- New [+]
- The result exists in the second report but not in the first report (according to order of selection).
- Same [=]
- The result exists in both reports and is equal.
- Changed [~]
- The result exists in both reports but is different.
The term delta_states= can be entered into the filter bar to show only a specific type of delta results (see Chapter 8.3).
delta_states=gshows all results of the type Gone.delta_states=nshows all results of the type New.delta_states=sshows all results of the type Same.delta_states=cshows all results of the type Changed.
Tip
Multiple types can be displayed at the same time, e.g., delta_states=gs shows all results of the type Gone and Same.
11.2.6 Quality of Detection Concept
The quality of detection (QoD) is a value between 0 % and 100 % describing the reliability of the executed vulnerability detection or product detection.
While the QoD range allows to express the quality quite fine-grained, most tests use a standard methodology. Therefore, QoD types are associate with a QoD value. The current list of types may be extended over time.
Note
The QoD of a “Detection” result is higher than that of an actual “Vulnerability” Result as it reflects the quality of the product detection itself – which is reliable – and not the quality of the related vulnerability tests which may be unreliable for various reasons (see table).
| QoD | QoD Type | Description |
|---|---|---|
| 100 % | exploit | The detection happened via an exploit and is therefore fully verified. |
| 99 % | remote_vul | Remote active checks (code execution, traversal attack, SQL injection etc.) in which the response clearly shows the presence of the vulnerability. |
| 98 % | remote_app | Remote active checks (code execution, traversal attack, SQL injection etc.) in which the response clearly shows the presence of the vulnerable application. |
| 97 % | package | Authenticated package-based checks for Linux(oid) systems. |
| 97 % | registry | Authenticated registry based checks for Microsoft Windows systems. |
| 95 % | remote_active | Remote active checks (code execution, traversal attack, SQL injection etc.) in which the response shows the likely presence of the vulnerable application or of the vulnerability. “Likely” means that only rare circumstances are possible in which the detection would be wrong. |
| 80 % | remote_banner | Remote banner checks of applications that offer patch level in version. Many proprietary products do so. |
| 80 % | executable_version | Authenticated executable version checks for Linux(oid) or Microsoft Windows systems where applications offer patch level in version. |
| 75 % | If results without any QoD information are processed (e.g., when migrating data from a legacy system to a currently supported system), they are assigned this value. | |
| 70 % | remote_analysis | Remote checks that do some analysis but which are not always fully reliable. |
| 50 % | remote_probe | Remote checks in which intermediate systems such as firewalls may pretend correct detection so that it is actually not clear whether the application itself answered. For example, this can happen for non-TLS connections. |
| QoD | QoD Type | Description |
|---|---|---|
| 30 % | remote_banner_unreliable | Remote banner checks of applications that do not offer patch level in version identification. For example, this is the case for many open source products due to backport patches. |
| 30 % | executable_version_unreliable | Authenticated executable version checks for Linux(oid) systems where applications do not offer patch level in version identification. |
| 1 % | general_note | General note on potential vulnerability without finding any present application. |
By default, only results that were detected by VTs with a QoD of 70 % or higher are displayed. Results detected by a test with a lower QoD are prone to false positives. The filter can be adjusted to show results with a lower QoD (see Chapter 8.3.1).
Note
When changing the default filter to show results detected by a test with a low QoD, it is one’s own responsibility to determine if it is a false positive.
11.3 Displaying all Existing Results
List Page
While the reports only contain the results of one single scan, all results are saved in the internal database and can be viewed by selecting Scans > Results in the menu bar.
Powerfilters can be used to display only interesting results (see Chapter 8.3).
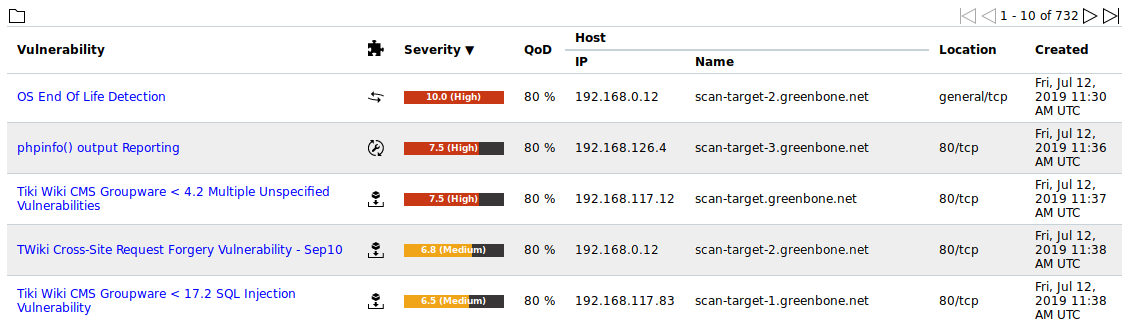
Fig. 11.14 Page Results showing all results of all scans
For all results the following information is displayed:
- Vulnerability
Name of the found vulnerability.
Vulnerabilities with an attached note are marked with
.
Vulnerabilities with an attached ticket are marked with .Note
If the column of the vulnerability still appears empty the respective VT has not been updated yet.
Note
Even though the results contain a lot of information, external references are always listed in the details.
These refer to webpages on which the vulnerability was already discussed.
Additional background information is available such as who discovered the vulnerability, what effects it could have and how it can be remediated.
- Solution type
To simplify the elimination of vulnerabilities every result offers a solution for problems. The column Solution type displays the existence of a solution. The following the solutions are possible:
- A vendor patch is available.
- A workaround is available.
- A mitigation by configuration is available.
- No fix is and will be available.
- No solution exists.
- Severity
- Severity of the vulnerability. The severity of the vulnerability (CVSS, see Chapter 14.2.4) is displayed as a bar to support the analysis of the results.
- QoD
The quality of detection (QoD) is a value between 0 % and 100 % describing the reliability of the executed vulnerability detection or product detection.
By default, only results that were detected by VTs with a QoD of 70 % or higher are displayed. The filter can be adjusted to show results with a lower QoD (see Chapter 8.3.1).
For more information about the QoD see Chapter 11.2.6.
- Host
- Host for which the result was found. The IP address and the name of the host are displayed separately.
- Location
- Port number and protocol type used to find the result on the host.
- Created
- Date and time of the report creation.
Note
By clicking  below the list of results more than one result can be exported at a time. The drop-down list is used to select which results exported.
Details Page
Click on the name of a result to display the details of the result.
Click to open the details page of the result.
The following registers are available:
- Information
- General information about the result.
- User Tags
- Assigned tags (see Chapter 8.4).
The following actions are available in the upper left corner:
- Open the corresponding chapter of the user manual.
- Show the list page of all results.
- Export the result as an XML file.
 Create a new note for the result (see Chapter 11.7.1).
 Create a new override for the result (see Chapter 11.8.1).
 Create a new ticket for the result (see Chapter 11.6.1).
- Show the corresponding task.
 Show the corresponding report.
11.4 Displaying all Existing Vulnerabilities
List Page
While the reports only contain the vulnerabilities of one single scan, all vulnerabilities are saved in the internal database and can be viewed by selecting Scans > Vulnerabilities in the menu bar.
Powerfilters can be used to display only interesting vulnerabilities (see Chapter 8.3).
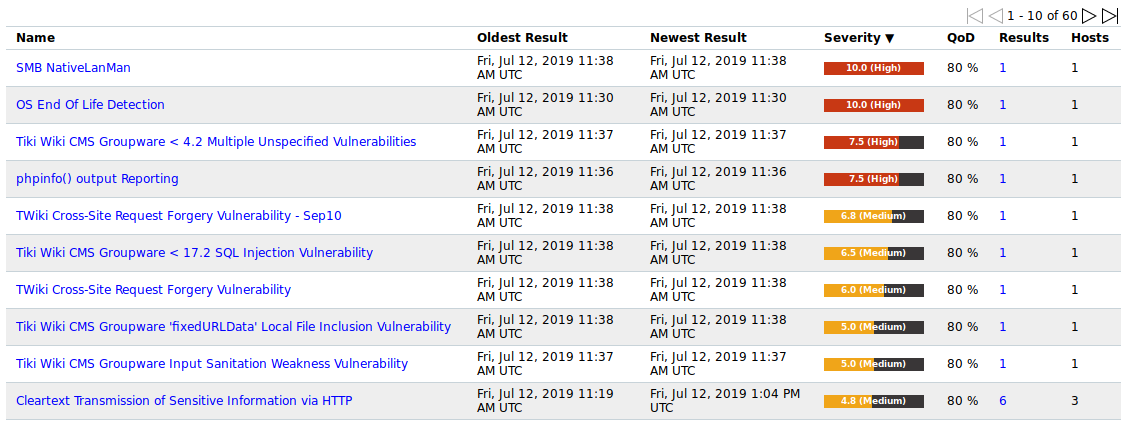
Fig. 11.15 Page Vulnerabilities showing all vulnerabilities of all scans
For all vulnerabilities the following information is displayed:
- Name
- Title of the vulnerability.
- Oldest Result
- Date and time of the oldest result that was found for the vulnerability.
- Newest Result
- Date and time of the newest result that was found for the vulnerability.
- Severity
- Severity of the vulnerability. To support the administrator with the analysis of the results, the severity of a vulnerability (CVSS, see also Chapter 14.2.4) is displayed as a bar.
- QoD
The quality of detection (QoD) is a value between 0 % and 100 % describing the reliability of the executed vulnerability detection or product detection.
By default, only results that were detected by VTs with a QoD of 70 % or higher are displayed. The filter can be adjusted to show results with a lower QoD (see Chapter 8.3.1).
For more information about the QoD see Chapter 11.2.6.
- Results
- Number of results found for this vulnerability. By clicking on the number of results the page Results is opened. A filter is applied to show only the results for the selected vulnerability.
Note
By clicking below the list of results more than one result can be exported at a time. The drop-down list is used to select which results exported.
Details Page
Click on the name of a vulnerability to open the details page of the vulnerability.
The following actions are available in the upper left corner:
- Open the corresponding chapter of the user manual.
- Show the list page of all vulnerabilities.
- Export the vulnerability as an XML file.
- Create a new note for the vulnerability (see Chapter 11.7.1).
- Create a new override for the vulnerability (see Chapter 11.8.1).
- Show the corresponding results.
- Show the corresponding vulnerability.
11.5 Trend of Vulnerabilities
If a task has been run multiple times the trend of discovered vulnerabilities is displayed on the page Tasks (see Fig. 11.16).
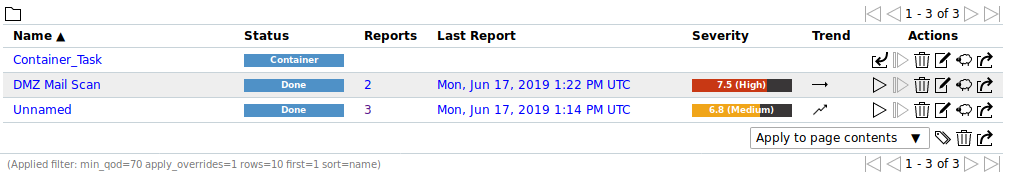
Fig. 11.16 Task with trend
To get there select Scans > Tasks in the menu bar.
The trend describes the change of vulnerabilities between the newest and the second newest report. It is displayed in the column Trend.
The following trends are possible:
 In the newest report the highest severity is higher than the highest severity in the second newest report.
 The highest severity is the same for both reports. However, the newest report contains more security issues of this severity than the second newest report.
 The highest severity and the amount of security issues are the same for both reports.
 The highest severity is the same for both reports. However, the newest report contains less security issues of this severity than the second newest report.
 In the newest report the highest severity is lower than the highest severity in the second newest report.
11.6 Using Tickets
Users can task other users or themselves to resolve findings of a scan.
11.6.1 Creating a Ticket
A ticket can be created as follows:
Select Scans > Reports in the menu bar and click on the date of a report to show the results.
Click on an item in the column Vulnerability and
to open the details page of the result.or
Select Scans > Results in the menu bar.
Click on an item in the column Vulnerability and
to open the details page of the result.Create a new ticket by clicking
.Select the user to whom the ticket should be assigned in the drop-down list Assign to User (see Fig. 11.17).
Enter a note for the ticket in the input box Note.
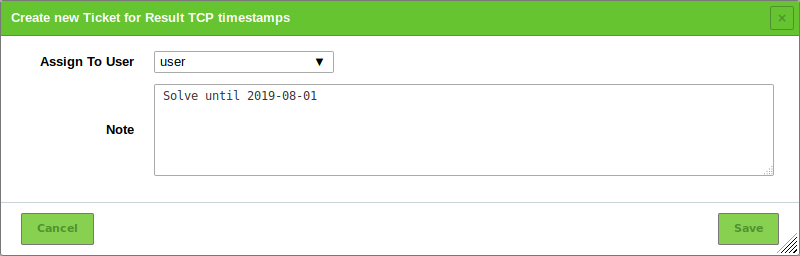
Fig. 11.17 Creating a new ticket
Click Save.
→ The number of tickets for a result are displayed in the upper left corner of the details page of the result (see Fig. 11.18). By clicking
the corresponding tickets are displayed.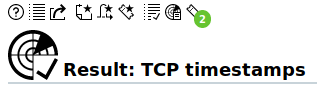
Fig. 11.18 Number of assigned tickets
11.6.2 Changing the Status of a Ticket
A ticket can have the following status:
- Open: the vulnerability has not been fixed yet.
- Fixed: the vulnerability has been fixed.
- Fixed verified: the task has been run again and the vulnerability was not found anymore. This status is set automatically.
- Closed: the fix of the vulnerability was verified or the ticket is not required anymore.
The status of a ticket can be changed as follows:
Select Resilience > Remediation Tickets in the menu bar.
In the row of the ticket, click
.Select the new status in the drop-down list Status (see Fig. 11.19).
Select the user to whom the ticket with the new status should be assigned in the drop-down list Assigned User.
Enter a note for the new status in the respective input box.
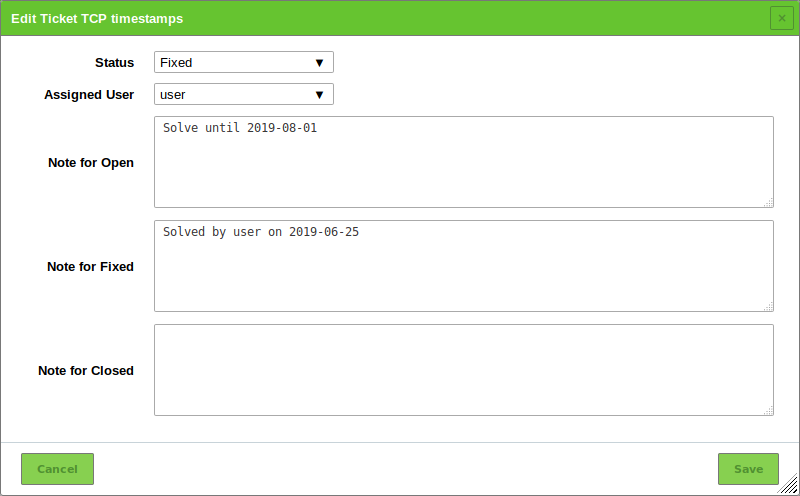
Fig. 11.19 Changing the status of a ticket
Click Save.
11.6.3 Setting an Alert for a Ticket
Alerts for tickets can be set for the following events:
- A new ticket is received.
- The status of an assigned ticket changed.
- The status of an own ticket changed.
An alert for tickets is set up as follows:
Select Configuration > Alerts in the menu bar.
Create a new alert by clicking
.Define the alert (see Fig. 11.20).
Click Save.
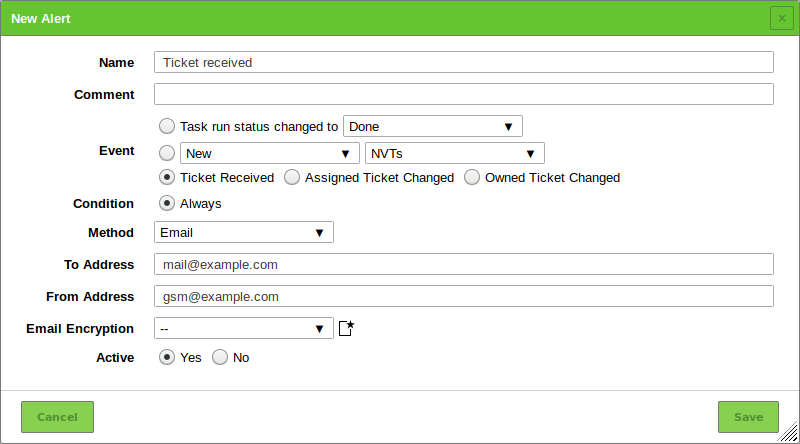
Fig. 11.20 Setting an alert for a ticket
The following details of the alert can be defined:
- Name
- Definition of the name. The name can be chosen freely.
- Comment
- An optional comment can contain additional information.
- Event
Select Ticket Received if an alert should be sent when a new ticket is assigned to oneself.
Select Assigned Ticket Changed if an alert should be sent when the status of a ticket assigned to oneself changes.
Select Owned Ticket Changed if an alert should be sent when the status of ticket assigned to another user changes.
- Method
Selection of the method for the alert. Only one method per alert can be chosen.
If different alerts for the same event should be triggered, multiple alerts must be created and linked to the same task.
The following methods are possible:
An e-mail is sent to the given address.
The transmission of the e-mail can by encrypted using a configurable S/MIME or GPG key. The encryption can be selected in the drop-down list Email Encryption or created by clicking
.- Start Task
- The alert can start an additional task. The task is selected in the drop-down list Start Task.
- System Logger
The alert is sent to a Syslog daemon.
The Syslog server is defined using the console (see Chapter 7.2.12).
11.6.4 Managing Tickets
List Page
All existing tickets can be displayed by selecting Resilience > Remediation Tickets in the menu bar.
For all tickets the following information is displayed:
- Vulnerability
- Vulnerability for which the ticket is created.
- Severity
- Severity of the vulnerability for which the ticket is created.
- Host
- Host on which the vulnerability was found.
- Solution Type
- Solution type of the vulnerability for which the ticket is created.
- Assigned User
- User to which the ticket is assigned.
- Modification Time
- Date and time of the last modification of the ticket.
- Status
- Status of the ticket.
For all tickets the following actions are available:
- Move the ticket to the trashcan.
- Edit the ticket.
 Clone the ticket.
Note
By clicking or below the list of tickets more than one ticket can be moved to the trashcan or exported at a time. The drop-down list is used to select which tickets are moved to the trashcan or exported.
Details Page
Click on the name of a ticket to display the details of the ticket.
Click to open the details page of the ticket.
The following registers are available:
- Information
- General information about the ticket.
- User Tags
- Assigned tags (see Chapter 8.4).
The following actions are available in the upper left corner:
- Open the corresponding chapter of the user manual.
- Show the list page of all tickets.
- Clone the ticket.
- Edit the ticket.
- Move the ticket to the trashcan.
- Export the ticket as an XML file.
11.7 Using Notes
Notes allow adding comments to a VT and are displayed in the reports as well. A note can be added to a specific result, task, severity, port or host and as such will only appear in specific reports. A note can be generalized as well so that it will be displayed in all reports.
11.7.1 Creating a Note
11.7.1.1 Creating a Note Through a Scan Result
Notes can be created in different ways. The simplest way is through the respective scan result in a report:
Select Scans > Reports in the menu bar.
Click on the date of the report to show the results.
Select the register Results.
Click on a result in the column Vulnerability.
Click
to to open the details page of the result.Click
in the upper left corner of the page.Define the note (see Fig. 11.21).
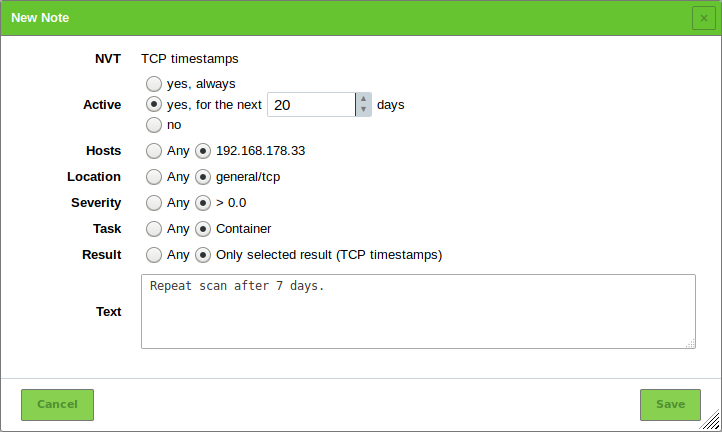
Fig. 11.21 Creating a new note
Click Save.
→ The note is displayed on the details page of the result (see Fig. 11.22).
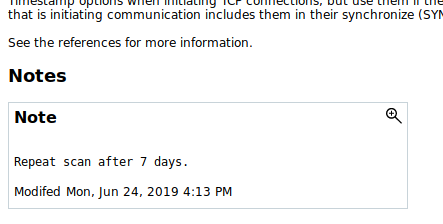
Fig. 11.22 Report containing a note
11.7.1.2 Creating a Note on the Page Notes
Notes can be created on the page Notes as well:
Select Scans > Notes in the menu bar.
Create a new note by clicking
.Enter the ID of the VT in the input box NVT OID.
Define the note.
Tip
It is possible to enter ranges of IP addresses and CIDR blocks in the input box Hosts. In that way, notes for entire subnets can be created without having to specify every host in a comma-separated list.
Notes can be generalized by selecting the radio button Any for hosts, locations, severities, tasks or results.
Click Save.
11.7.2 Managing Notes
List Page
All existing notes can be displayed by selecting Scans > Notes in the menu bar (see Fig. 11.23).
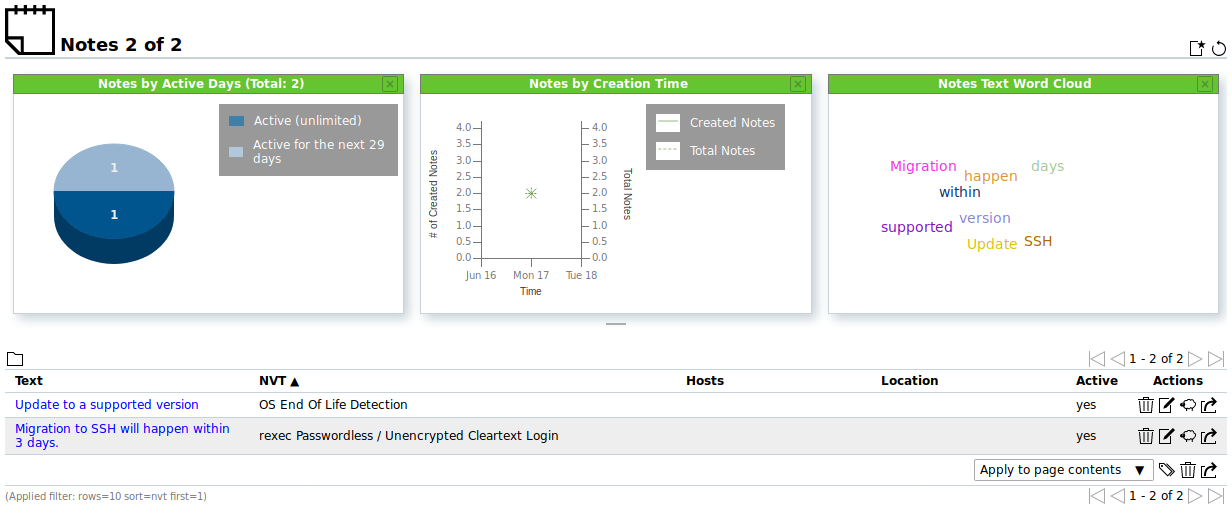
Fig. 11.23 Managing notes
For all notes the following actions are available:
- Move the note to the trashcan.
- Edit the note.
- Clone the note.
- Export the note as an XML file.
Note
By clicking or below the list of notes more than one note can be moved to the trashcan or exported at a time. The drop-down list is used to select which notes are moved to the trashcan or exported.
Details Page
Click on the name of a note to display the details of the note.
Click to open the details page of the note.
The following registers are available:
- Information
- General information about the note.
- User Tags
- Assigned tags (see Chapter 8.4).
- Permissions
- Assigned permissions (see Chapter 9.4).
The following actions are available in the upper left corner:
- Open the corresponding chapter of the user manual.
- Show the list page of all notes.
- Create a new note (see Chapter 11.7.1).
- Clone the note.
- Edit the note.
- Move the note to the trashcan.
- Export the note as an XML file.
11.8 Using Overrides and False Positives
The severity of a result can be modified. This is called override.
Overrides are especially useful to manage results that are detected as a false positive and that have been given a critical severity but should be given a different severity in the future.
The same applies to results that only have been given the severity Log but should be assigned a higher severity locally. This can be managed with an override as well.
Overrides are also used to manage acceptable risks.
11.8.1 Creating an Override
11.8.1.1 Creating an Override Through a Scan Result
Overrides can be created in different ways. The simplest way is through the respective scan result in a report:
Select Scans > Reports in the menu bar.
Click on the date of the report to show the results.
Select the register Results.
Click on a result in the column Vulnerability.
Click
to to open the details page of the result.Click
in the upper left corner of the page.Define the override. Select the new severity in the drop-down list New Severity (see Fig. 11.24).
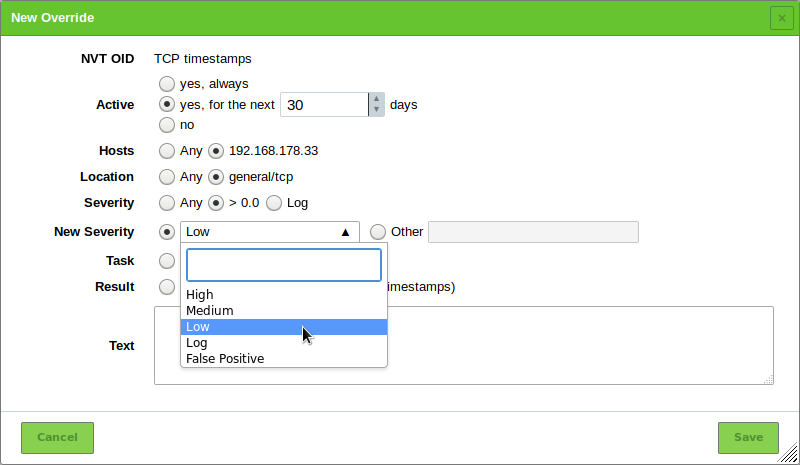
Fig. 11.24 Creating a new override
Click Save.
The following information can be entered:
Note
If an override is created through a scan result, some settings are already filled in.
- NVT
- VT for which the override is applied.
- Active
- Selection whether the override should be activated. An activation for an arbitrary number of days is possible as well.
- Hosts
Host or range of hosts for which the result must be found for the override to apply.
Tip
It is possible to enter ranges of IP addresses and CIDR blocks. In that way, overrides for entire subnets can be created without having to specify every host in a comma-separated list.
Host ranges are specified with a minus, e.g.
198.168.1.1-198.168.1.25. A range bigger than 4096 is not supported.Note
Conflicting overrides, e.g. an override for a host range and another override for a host inside that range, are not permitted.
- Location
- Port for which the result must be found for the override to apply.
Only a specific port or the setting Any are supported per override.
A specific port must be supplied as a number followed by
/tcpor/udp. - Severity
- Range of severity of the VT for which the overrides should be applied.
- New Severity
- Severity the VT should have after the override is applied.
- Task
- Selection of tasks for which the override should be applied.
- Result
Selection of results for which the override should be applied.
Note
The radio button Any has to be selected if the override should be applied to reports in the future.
- Text
- A text describes the override in more detail.
Note
If several overrides apply to the same VT in the same report the most recent override is used and applied.
11.8.1.2 Creating an Override on the Page Overrides
Overrides can be created on the page Overrides as well:
Select Scans > Overrides in the menu bar.
Create a new override by clicking
.Enter the ID of the VT in the input box NVT OID.
Define the override.
Note
For the information to enter in the input boxes see Chapter 11.8.1.1.
Select the new severity in the drop-down list New Severity.
Click Save.
11.8.2 Managing Overrides
List Page
All existing overrides can be displayed by selecting Scans > Overrides in the menu bar.
For all overrides the following actions are available:
- Move the override to the trashcan.
- Edit the override.
- Clone the override.
- Export the override as an XML file.
Note
By clicking or below the list of overrides more than one override can be moved to the trashcan or exported at a time. The drop-down list is used to select which overrides are moved to the trashcan or exported.
Details Page
Click on the name of an override to display the details of the override.
Click to open the details page of the override.
The following registers are available:
- Information
- General information about the override.
- User Tags
- Assigned tags (see Chapter 8.4).
- Permissions
- Assigned permissions (see Chapter 9.4).
The following actions are available in the upper left corner:
- Open the corresponding chapter of the user manual.
- Show the list page of all overrides.
- Create a new override (see Chapter 11.8.1).
- Clone the override.
- Edit the override.
- Move the override to the trashcan.
- Export the override as an XML file.
11.8.3 Disabling and Enabling Overrides
If overrides change the display of the results, the overrides can be enabled or disabled.
This is done by setting the filter as follows:
Click
in the filter bar.For Apply Overrides select the radio button Yes to enable overrides.
For Apply Overrides select the radio button No to disable overrides.
Click Update.
Tip
Overrides can be labelled in exported reports (see Chapter 11.2.2).
11.9 Using Business Process Maps
A Business Process Map (BPM) is used to illustrate the impact of collected results on a business.
Business processes are modeled using nodes (= processes) and edges (= connections).
Each node is assigned with the host on which the process takes place. The node is colored according to the highest severity of the host.
The following colors are possible:
- Red: one or more host(s) has/have the severity High
- Yellow: one or more host(s) has/have the severity Medium but no host has a higher severity
- Blue: one or more host(s) has/have the severity Low but no host has a higher severity
- Light gray: one or more host(s) has/have the severity Log but no host has a higher severity
- Dark gray: no severities are available for the host(s) (N/A)
- White: no hosts are associated with this process
If a process is vulnerable and might affect a following process, the coloration of this following process is adjusted.
By this, it is possible to detect the vulnerabilities of processes and their impact on subsequent processes.
The following rules apply for the color overriding:
- Higher severities override lower severities: High > Medium > Low > Log
- Log does not override the missing assignment of hosts
- N/A does not override Log
Loading and saving the BMP is completely automatic. The map is loaded when the page Business Process Map is opened. Changes are saved as soon as they are done.
The BPM cannot be shared or exported/imported.
11.9.1 Navigating the Business Process Map
The map can be moved by clicking and dragging the background.
The map can be zoomed from a scale of 0.3 to 1.6 by using the mouse wheel or clicking  and
and  .
The font size will adjust for better readability.
.
The font size will adjust for better readability.
Clicking  jumps to the starting position in the map and resets the zoom.
11.9.2 Creating a Business Process Map
Select Resilience > Business Process Map in the menu bar.
Click
 to create a process node.
→ The process node is created and displayed on the map (see Fig. 11.25).
For each process a standard tag is created on the page Tags (see Chapter 8.4.4). The name of the tag corresponds to the name of the process, preceded by “myBP:”. If the process is renamed, the tag’s name is changed as well, while the tag’s ID remains the same.
Note
The created tags should not be edited manually.
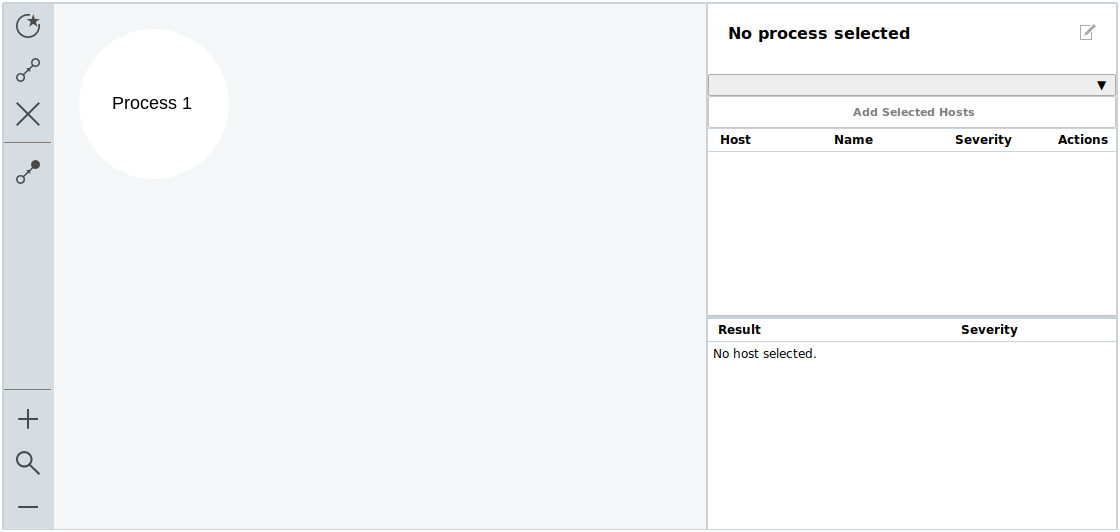
Fig. 11.25 Creating a new process
Note
At most 50 processes can be created for a BPM.
Select the process node by clicking it.
→ The node is marked by a blue border.
Select the hosts that should be assigned to the process in the drop-down list (see Fig. 11.26).
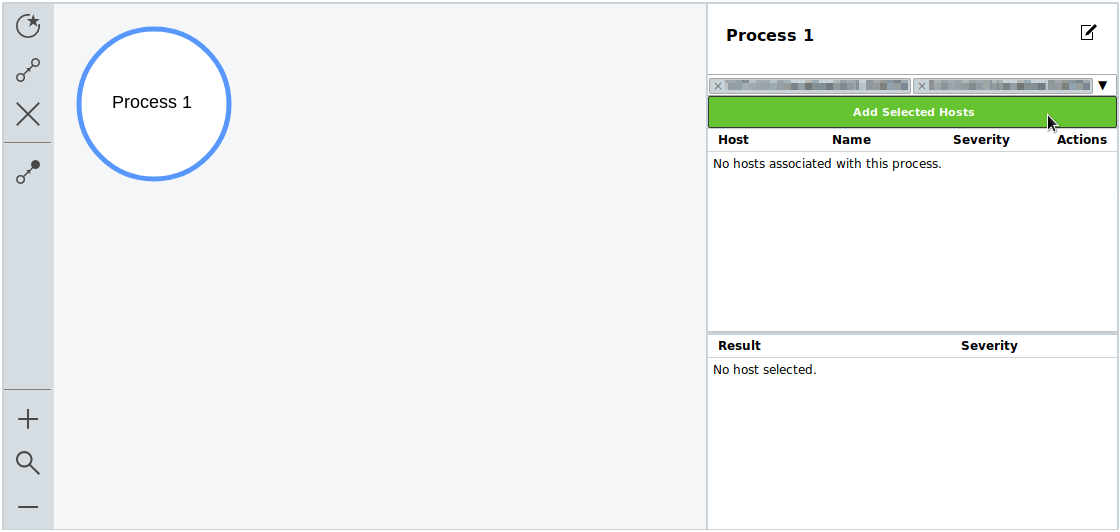
Fig. 11.26 Assigning hosts to a process
Click Add Selected Hosts.
→ The process node is colored according to the host’s highest severity.
When the process node is selected, the hosts are displayed in the table on the right (see Fig. 11.27).
By clicking
the details page of the host is opened (see Chapter 13.1.2).By clicking on a host, the results found for this hosts are displayed in a table below (see Fig. 11.27). Clicking on a result opens its details page (see Chapter 11.3).

Fig. 11.27 Hosts and results of a process
Note
Each host assigned to a process is tagged with the standard tag created for the corresponding process (see step 2) (see Chapter 8.4.4).
Note
While it is possible to assign unlimited hosts to a process, there is a maximum of 100 hosts per process that will actually be shown in the table on the right and considered when estimating the node’s color.
If the limit is exceeded, a warning is shown above the host table.
Create a second (or more) process node(s) (see steps 2 – 5).
Click
 to create a new connection.
→ The “draw” mode is activated.
Click the source process node.
→ The node is marked by a blue border (see Fig. 11.28).
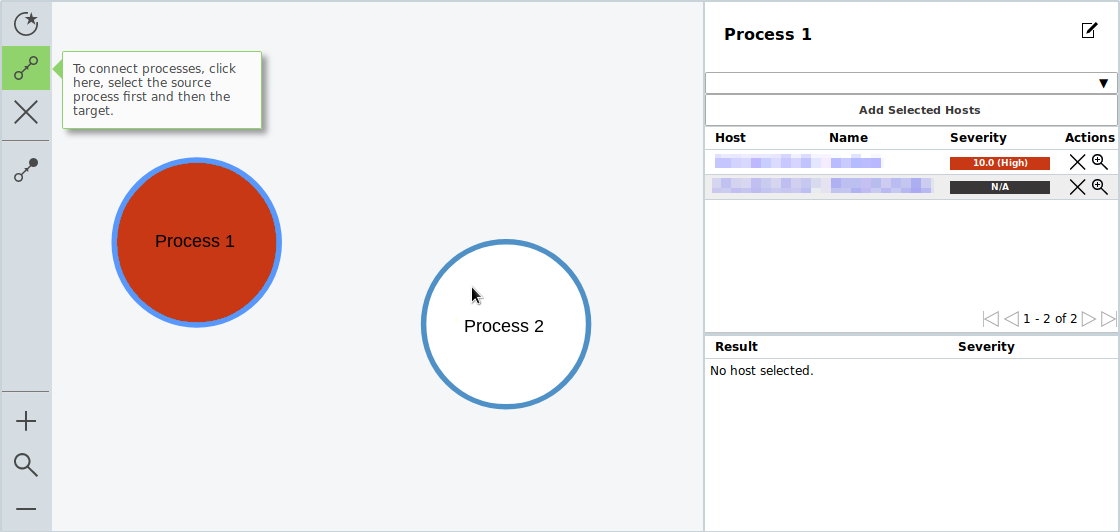
Fig. 11.28 Creating a connection
Click the target process node.
→ The connection is created. The arrow indicates the direction of influence (see Fig. 11.29).
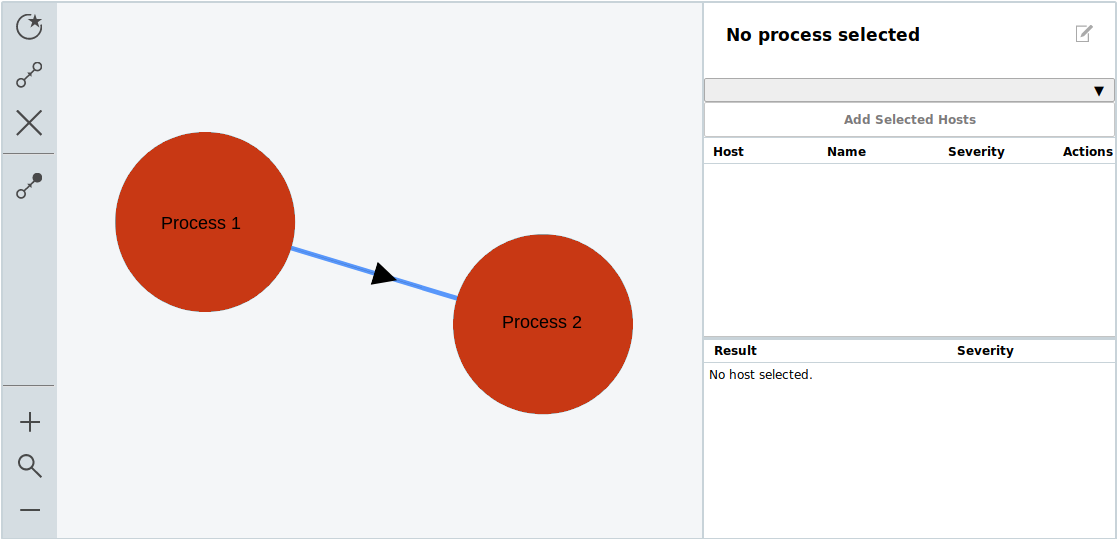
Fig. 11.29 Newly created connection
If conditional colorization is enabled, the color of the primary process is assigned to the following process(es) as well, i.e., the color of the following process node(s) is the same as that of the primary process node. A tooltip shows the original severity of the process.
To find a source process easily, the conditional colorization can be disabled by clicking
 .
The icon is highlighted in green if the conditional colorization is disabled.
.
The icon is highlighted in green if the conditional colorization is disabled.Leave the “draw” mode by clicking any empty space in the map or by pressing Esc.
11.9.3 Editing a Business Process Map
11.9.3.1 Editing a Process
A process can be edited as follows:
- Select Resilience > Business Process Map in the menu bar.
- Click the desired process node.
- Click to change the name or the description of the process.
- Select additional hosts that should be assigned to the process in the drop-down list and click Add Selected Hosts.
- Click to remove a host from the process.
11.9.3.2 Deleting Elements
Elements of the map (process nodes and connections) can be deleted by selecting the element and pressing Delete or clicking .
If a process is deleted that is either the source or the target of a connection, the connection is removed as well.