6 Reports and Vulnerability Management
The results of a scan are summarized in a report. Reports can be displayed and downloaded in different formats.
The Greenbone Cloud Service saves not only the latest report of a scan but all reports of all scans ever run. This allows access to information from the past. The reports contain the discovered vulnerabilities and information of a scan.
Once a scan has been started, the report of the results found so far can be viewed. When a scan is completed, the status changes to Done and no more results will be added.
6.1 Reading a Report
An overview of all existing reports of a task can be displayed by selecting Scan Management in the menu panel and clicking on the number of reports in the column Reports (see Fig. 6.1).
The following information is displayed:
- Date
Date and time of report creation.
Unfinished scans are marked with
 .
.- Severity
Highest severity found on the target.
- Critical/Medium/Low/Log
Number of found vulnerabilities for each severity class.

Show all results for the respective report.

Delete a specific report.
- Executive PDF
By clicking
 the “Executive Report” can be downloaded.
It contains general information about the scan and lists of hosts sorted by severity.
the “Executive Report” can be downloaded.
It contains general information about the scan and lists of hosts sorted by severity.- Technical PDF
By clicking
the “Technical Report” can be downloaded.
It contains general information about the scan as well as about the scanned hosts and details for each found vulnerability.
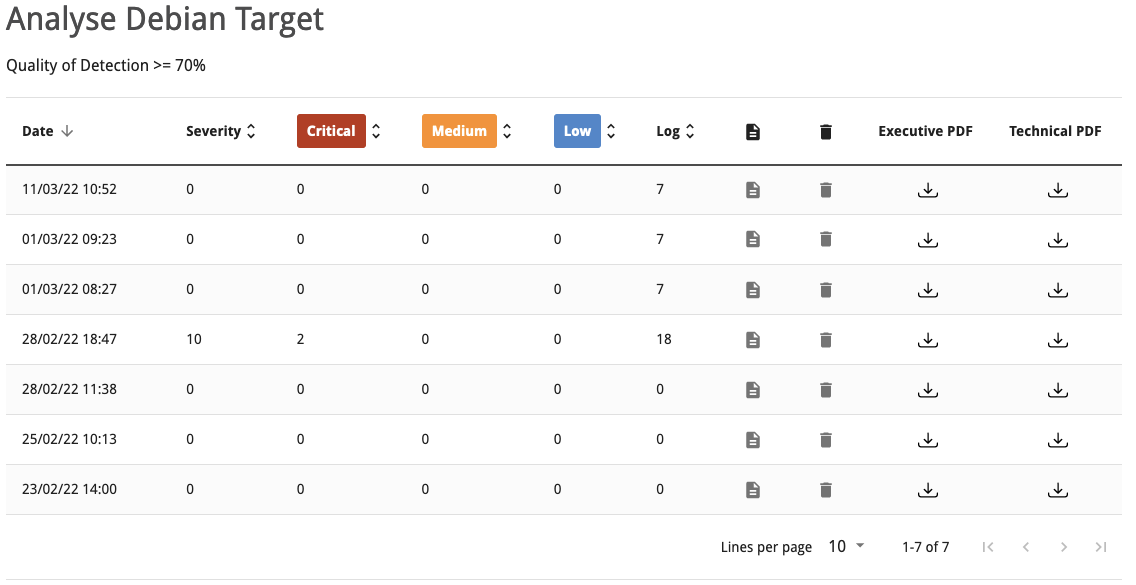
Fig. 6.1 Summary of all reports of a scan
6.1.1 Interpreting a Report
To interpret the results, note the following information:
- Multiple findings can have the same cause.
If an especially old software package is installed, often multiple vulnerabilities exist. Each of these vulnerabilities is tested by an individual VT and causes an alert. The installation of a current package will remove a lot of vulnerabilities at once.
- Critical
 and Medium
Findings of the severity levels Critical and Medium are most important and should be addressed with priority. Before addressing medium level findings, critical level findings should get addressed. Only in exceptional cases this approach should be deviated from, for example if it is known that the high level findings need to be less considered because the service cannot be reached through the firewall.
- Critical
- Low
 and Log
Findings of the severity levels Low and Log are mostly interesting for detail understanding. These findings are filtered out by default but can hold very interesting information. Considering them will increase the security of the network and the systems. Often a deeper knowledge of the application is required for their understanding. Typical for a result with the severity Log is that a service uses a banner with its name and version number. This could be useful for an attacker when this version has a known vulnerability.
Note
VTs that are terminated by timeout before a result is received are reported with the severity Low and a Quality of Detection (QoD) of 0 (see Chapter 6.1.2). More information about this error can be found in the details of such results.
- Low
6.1.2 Quality of Detection Concept
The quality of detection (QoD) is a value between 0 % and 100 % describing the reliability of the executed vulnerability detection or product detection.
While the QoD range allows to express the quality quite fine-grained, most tests use a standard methodology. Therefore, QoD types are associate with a QoD value. The current list of types may be extended over time.
Note
The QoD of a “Detection” result is higher than that of an actual “Vulnerability” result as it reflects the quality of the product detection itself – which is reliable – and not the quality of the related vulnerability tests which may be unreliable for various reasons (see table).
The lowest QoD that could apply is always used, for example in case of multiple detection methods (remote or local/authenticated).
QoD |
QoD Type |
Description |
|---|---|---|
100 % |
exploit |
The detection happened via an exploit and is therefore fully verified. |
99 % |
remote_vul |
Remote active checks (code execution, traversal attack, SQL injection etc.) in which the response clearly shows the presence of the vulnerability. |
98 % |
remote_app |
Remote active checks (code execution, traversal attack, SQL injection etc.) in which the response clearly shows the presence of the vulnerable application. |
97 % |
package |
Authenticated package-based checks for Linux(oid) systems. |
97 % |
registry |
Authenticated registry based checks for Microsoft Windows systems. |
95 % |
remote_active |
Remote active checks (code execution, traversal attack, SQL injection etc.) in which the response shows the likely presence of the vulnerable application or of the vulnerability. “Likely” means that only rare circumstances are possible in which the detection would be wrong. |
80 % |
remote_banner |
Remote banner checks of applications that offer patch level in version. Many proprietary products do so. |
80 % |
executable_version |
Authenticated executable version checks for Linux(oid) or Microsoft Windows systems where applications offer patch level in version. |
75 % |
If results without any QoD information are processed, they are assigned this value. |
|
70 % |
remote_analysis |
Remote checks that perform some analysis, but may not always be completely reliable depending on environmental conditions. Narrowing down suspected false-positive or false-negative edge cases may require analysis by the user. |
50 % |
remote_probe |
Remote checks in which intermediate systems such as firewalls may pretend correct detection so that it is actually not clear whether the application itself answered. For example, this can happen for non-TLS connections. |
30 % |
remote_banner_unreliable |
Remote banner checks of applications that do not offer patch level in version identification. For example, this is the case for many open source products due to backport patches. |
30 % |
executable_version_unreliable |
Authenticated executable version checks for Linux(oid) systems where applications do not offer patch level in version identification. |
1 % |
general_note |
General note on potential vulnerability without finding any present application. |
0 % |
timeout |
The test was unable to determine a result before it was ended by timeout. |
By default, only results that were detected by VTs with a QoD of 70 % or higher are displayed. Results detected by a test with a lower QoD are prone to false positives. The filter can be adjusted to show results with a lower QoD (see Chapter 6.3).
Note
When changing the default filter to show results detected by a test with a low QoD, it is one’s own responsibility to determine if it is a false positive.
6.2 Results of a Report
A report can be opened by clicking ![]() for the desired report in the report overview (see Fig. 6.1).
for the desired report in the report overview (see Fig. 6.1).
Tip
The latest report of a scan can be displayed by selecting Scan Management in the menu panel and clicking ![]() in the row of the scan.
in the row of the scan.
The name, date and time of the scan as well as the highest found severity are displayed at the top.
The following registers are available:
Dashboard
Grid Overview
Table Overview
6.2.1 Dashboard
The dashboard provides a summarizing overview of the found vulnerabilities, their severities and their possible solutions.
The following information is displayed:
Total number of detected vulnerabilities
Number of detected vulnerabilities for each solution type
Number of detected vulnerabilities for each severity level
The two solutions with the highest fix percentage
Risk level (highest found severity)
Top 10 hosts with number of found vulnerabilities and distribution of severities (sorted by number of vulnerabilities or by severity)
6.2.2 Grid Overview
The grid overview shows all found vulnerabilities sorted from highest to lowest severity.
By clicking Filter + the results can be filtered (see Chapter 6.3).
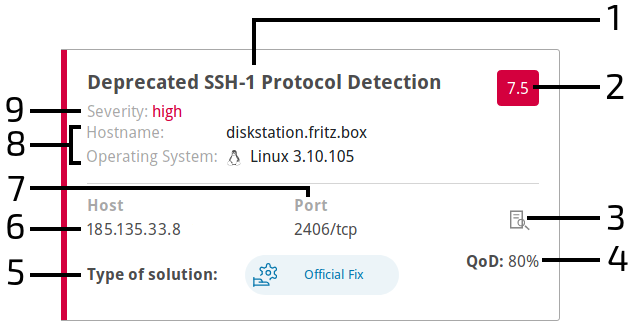
Fig. 6.2 Result of a scan
For every result the following information is displayed:
1 – Name of the found vulnerability.
2 – Severity of the vulnerability.
3 – Open an overlay showing details of the vulnerability.
4 – QoD is short for “Quality of Detection” and shows the reliability of the detection of a vulnerability (see Chapter 6.1.2).
5 – Solution type for the found vulnerability. The following the solutions are possible:
Official Fix: an official vendor patch is available. Unless otherwise noted, it is assumed that this fix fully resolves the vulnerability.
Temporary Fix: a workaround (information about a configuration or a specific deployment scenario that can be used to avoid exposure to the vulnerability) is available to temporarily eliminate the vulnerability.
There can be none, one or more workaround(s) available.
This is usually the “first line of defense” against a new vulnerability before a risk reduction or official fix has been issued or even discovered.
Risk Reduction: information about a configuration or deployment scenario that helps to reduce the risk of the vulnerability is available but that does not resolve the vulnerability on the affected product.
No Fix Available: there is no fix for the vulnerability and there never will be one.
This is often the case when a product has been orphaned, is no longer maintained or otherwise deprecated.
Searching for Fix: there is currently no solution available to remediate the vulnerability but there may be a solution in the future.
6 – Host for which the result was found.
7 – Port number and protocol type used to find the vulnerability on the host.
8 – Host name and operating system of the host for which the result was found.
9 – Severity level of the vulnerability.
6.2.3 Table Overview
The table overview shows the results of the scan in the form of different tables.
There are three different tables that can be selected (see Fig. 6.3):
Overview: all detected results
Host: results grouped by host
Vulnerability: results grouped by vulnerability
By clicking Filter + the results can be filtered (see Chapter 6.3).
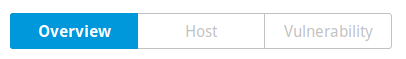
Fig. 6.3 Different tables in the table overview
6.2.3.1 “Overview” Table
For every result the following information is displayed:
- Name
Name of the corresponding vulnerability.
- Severity
Severity of the corresponding vulnerability. It is displayed with the color according to the severity level to support the analysis of the results.
- Host
Host for which the result was found.
- Port
Port number and protocol type used to find the result on the host.
- Solution
Solution for the corresponding vulnerability. The following the solutions are possible:
Official Fix: an official vendor patch is available. Unless otherwise noted, it is assumed that this fix fully resolves the vulnerability.
Temporary Fix: a workaround (information about a configuration or a specific deployment scenario that can be used to avoid exposure to the vulnerability) is available to temporarily eliminate the vulnerability.
There can be none, one or more workaround(s) available.
This is usually the “first line of defense” against a new vulnerability before a risk reduction or official fix has been issued or even discovered.
Risk Reduction: information about a configuration or deployment scenario that helps to reduce the risk of the vulnerability is available but that does not resolve the vulnerability on the affected product.
No Fix Available: there is no fix for the vulnerability and there never will be one.
This is often the case when a product has been orphaned, is no longer maintained or otherwise deprecated.
Searching for Fix: there is currently no solution available to remediate the vulnerability but there may be a solution in the future.
- QoD
QoD is short for “Quality of Detection” and shows the reliability of the detection of a vulnerability (see Chapter 6.1.2).
By default, only results that were detected by a VT with a QoD of 70 % or higher are displayed. The possibility of false positives is thereby lower. The filter can be adjusted to show results with a lower QoD (see Chapter 6.3).
- Details
By clicking
 an overlay is opened showing details of the vulnerability.
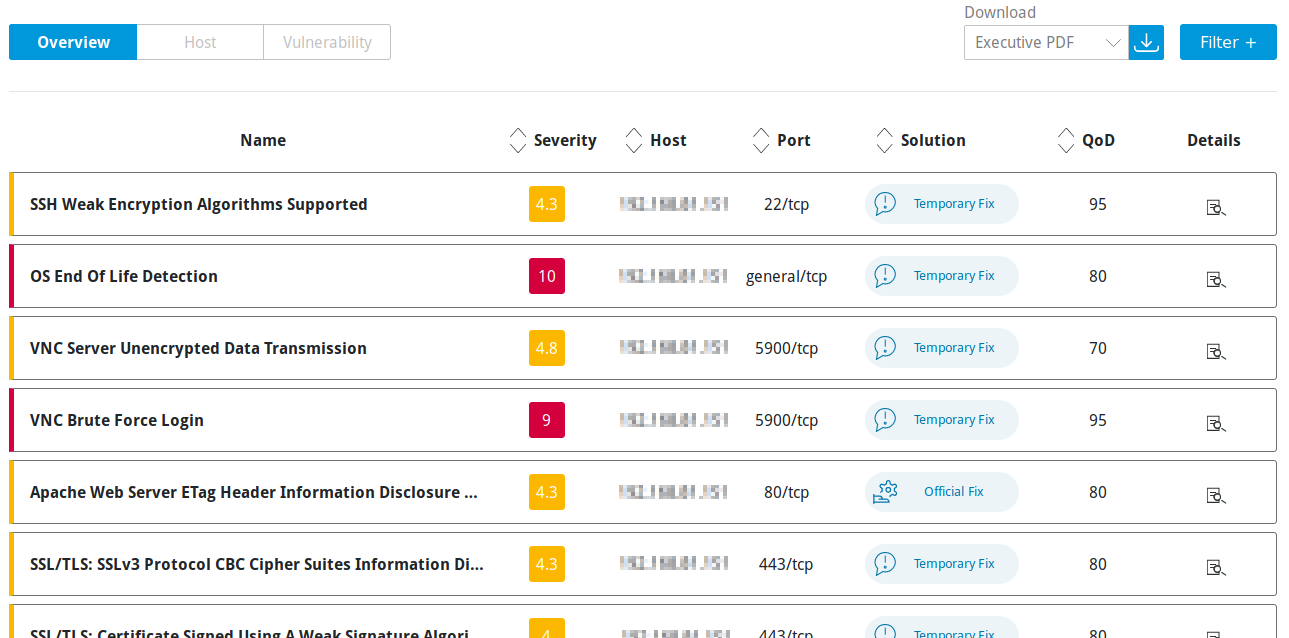
Fig. 6.4 Overview table
6.2.3.2 “Host” Table
For every host the following information is displayed:
- Name
IP address of the host.
- Severity
Highest severity found on the host.
- High/Medium/Low
Number of found vulnerabilities for each severity.
By clicking on a number, the top 20 vulnerabilities for the selected severity found on the respective host are displayed.
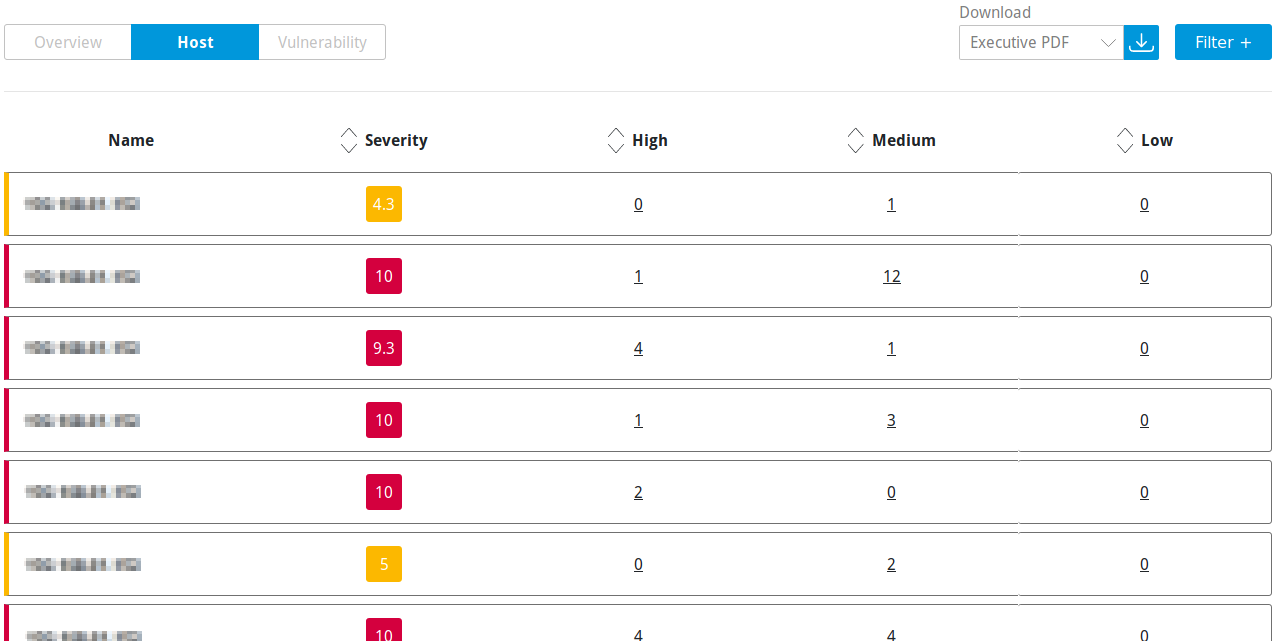
Fig. 6.5 Host table
6.2.3.3 “Vulnerability” Table
For every vulnerability the following information is displayed:
- Name
Name of the vulnerability.
- Severity
Severity of the vulnerability. It is displayed with the color according to the severity level to support the analysis of the results.
- Host
Number of hosts on which the vulnerability was found.
By clicking on the number, the top 20 hosts on which the vulnerability was found as well as additional details are displayed.
- Port
Number of ports by which the vulnerability was found.
By clicking on the number of ports, the top 20 ports by which the vulnerability was found as well as additional details are displayed.
- Solution
Solution for the corresponding vulnerability. The following the solutions are possible:
Official Fix: an official vendor patch is available. Unless otherwise noted, it is assumed that this fix fully resolves the vulnerability.
Temporary Fix: a workaround (information about a configuration or a specific deployment scenario that can be used to avoid exposure to the vulnerability) is available to temporarily eliminate the vulnerability.
There can be none, one or more workaround(s) available.
This is usually the “first line of defense” against a new vulnerability before a risk reduction or official fix has been issued or even discovered.
Risk Reduction: information about a configuration or deployment scenario that helps to reduce the risk of the vulnerability is available but that does not resolve the vulnerability on the affected product.
No Fix Available: there is no fix for the vulnerability and there never will be one.
This is often the case when a product has been orphaned, is no longer maintained or otherwise deprecated.
Searching for Fix: there is currently no solution available to remediate the vulnerability but there may be a solution in the future.
- QoD
QoD is short for “Quality of Detection” and shows the reliability of the detection of a vulnerability (see Chapter 6.1.2).
By default, only results that were detected by a VT with a QoD of 70 % or higher are displayed. The possibility of false positives is thereby lower. The filter can be adjusted to show results with a lower QoD (see Chapter 6.3).
- Details
By clicking
an overlay is opened showing details of the vulnerability.
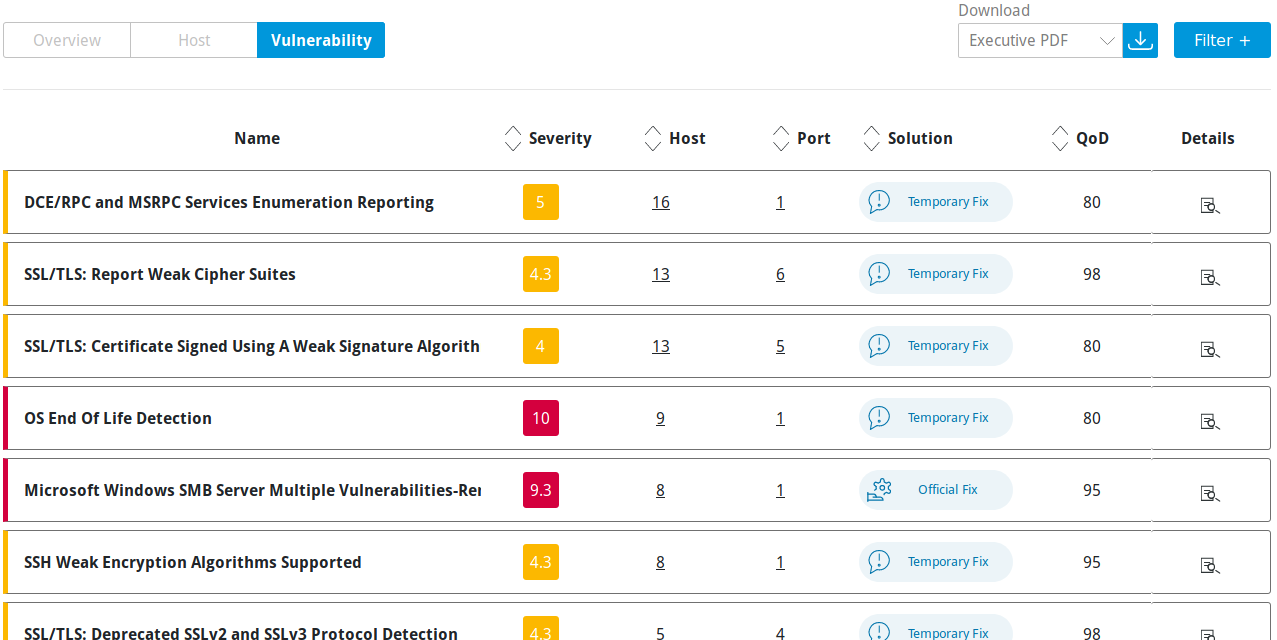
Fig. 6.6 Vulnerability table
6.3 Filtering a Report
Since a report often contains a lot of findings, the complete report as well as only filtered results can be displayed.
The grid overview or table overview of a report (see Chapter 6.2) can be filtered as follows:
Select Scan Management in the menu panel.
Click on the total number of reports in the column Reports.
→ The overview of all reports of a task is opened.
In the row of the desired report click
 .
.Select the register Grid Overview or Table Overview.
Click Filter +.
For Quality Of Detection Range (QoD) and Severity set the minimal and maximal values using the sliders (see Fig. 6.7).
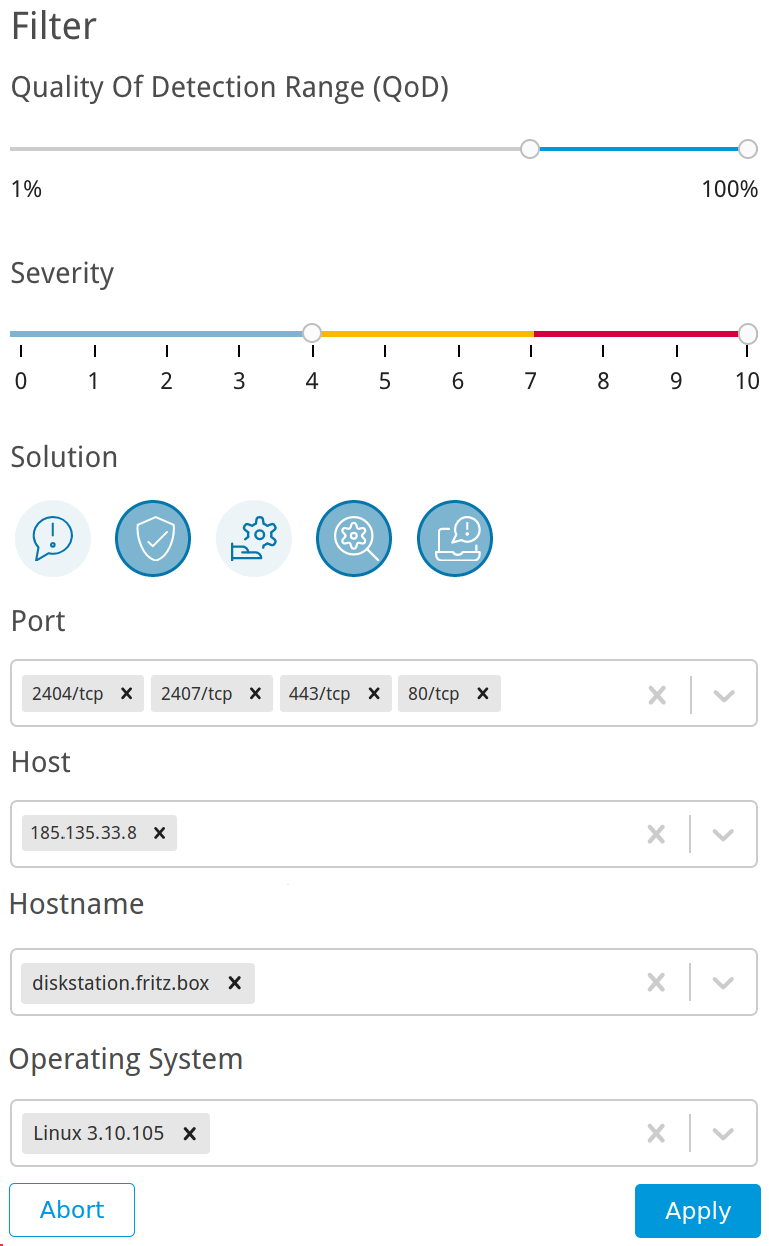
Fig. 6.7 Adjusting the filter for the report
For Solution select the buttons of the desired solution types.
Tip
The selected solution types are highlighted by a border.
For Port, Host, Hostname and Operating System select the ports, hosts, host names and operating systems in the drop-down lists for which the found results should be displayed.
Click Apply.
6.4 Exporting a Report
A report can be exported in various formats:
- Executive Report (PDF or JSON)
This report contains general information about the scan and lists of hosts sorted by severity.
- Technical Report (PDF or JSON)
This report contains general information about the scan as well as about the scanned hosts and details for each found vulnerability.
XML
A report can be exported as follows:
Select Scan Management in the menu panel.
Click on the total number of reports in the column Reports.
→ The overview of all reports of a scan is opened.
In the row of the desired report click
for Executive PDF or Technical PDF.Save the report by clicking OK.
or
Select Scan Management in the menu panel.
Click on the total number of reports in the column Reports.
→ The overview of all reports of a scan is opened.
In the row of the desired report click
.Select the register Grid Overview or Table Overview.
Select the desired report format in the drop-down list Download (see Fig. 6.8).
Click the slider Anonymized if IP addresses should be anonymized in the downloaded report.
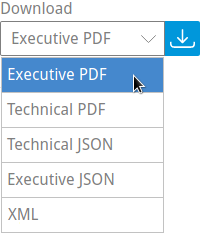
Fig. 6.8 Exporting a report
Click
 .
.Save the report by clicking OK.
6.5 Notifications for Reports
Notifications can be sent regularly as a summary of scans or when a report is complete (see Chapter 4.2).