1 vMSP and End Customer Overview
The dashboard is displayed when logging in to the platform.
By clicking Last Month or Current, the time frame for the dashboard can be selected. Forecast shows the probable development of the values based on the current ones.
The following information is displayed:
- Your Total Income
Total amount of money received from all end users of all vMSPs.
- Billing Method Selected
Number of subscriptions by respective category for all end customers of all vMSPs:
Free
MSP: managed-service customers
Self-service customers
Project: project keys with special conditions
- Total IP’s
Total number of all (internal and external) IP addresses sold to all end customers of all vMSPs.
- External
Number of external IP addresses sold to all end customers of all vMSPs.
- Internal
Number of internal IP addresses sold to all end customers of all vMSPs.
- Your Total Purchase
Total amount of money that is paid to Greenbone.
- Average Price per IP address
Average price per IP address that is paid to Greenbone.
- IP amounts in the last 6 Months
Development of number of sold IP addresses over time, separated into internal and external IP addresses.
Tip
A vMSP can be selected in the upper right corner. Only values for this vMSP and for end customers of this vMSP will be displayed in the dashboard.
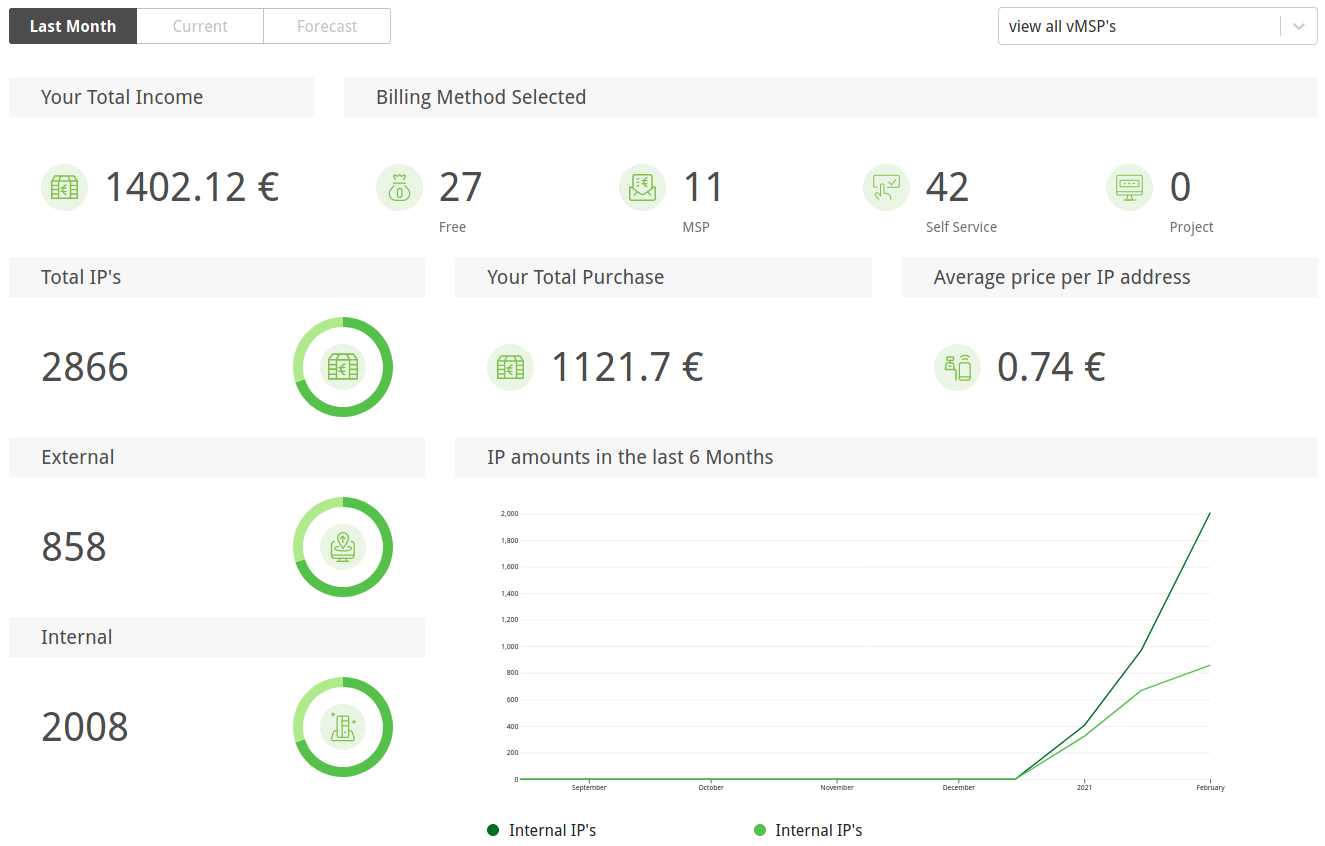
Fig. 1.1 Overview dashboard
The table below the dashboard shows the total amounts billed to vMSPs (see Fig. 1.2). The values shown are based on the selection Last Month, Current, or Forecast.
If Pricing is selected, the amounts of all end customers of the respective vMSP are added up.
If Details is selected, the individual end customers are displayed with the respective duration of use and the purchased IP addresses.
By clicking  a JSON file of the respective overview can be downloaded.
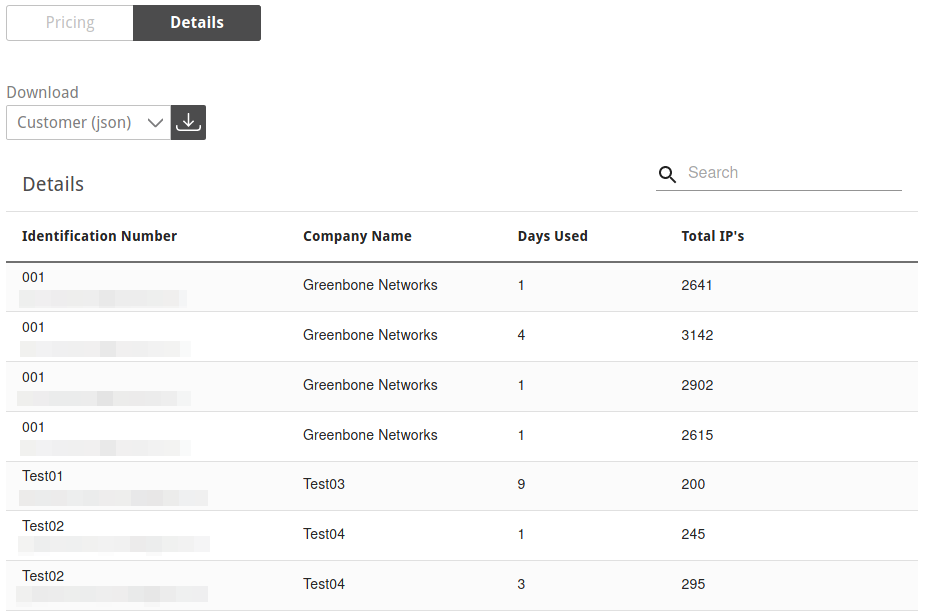
Fig. 1.2 List of all total amounts billed to vMSPs